. 2016 Sep 1;57(11):5023-5030.
doi: 10.1167/iovs.16-19700.

Heterozygous Pitx2 Null Mice Accurately Recapitulate the Ocular Features of Axenfeld-Rieger Syndrome and Congenital Glaucoma

Affiliations

Heterozygous Pitx2 Null Mice Accurately Recapitulate the Ocular Features of Axenfeld-Rieger Syndrome and Congenital Glaucoma

Lisheng Chen et al. Invest Ophthalmol Vis Sci. .

Abstract

Purpose: The purpose of this analysis was to assess the utility of Pitx2+/- mice as a model for the ocular features of Axenfeld-Rieger Syndrome and for congenital glaucoma.

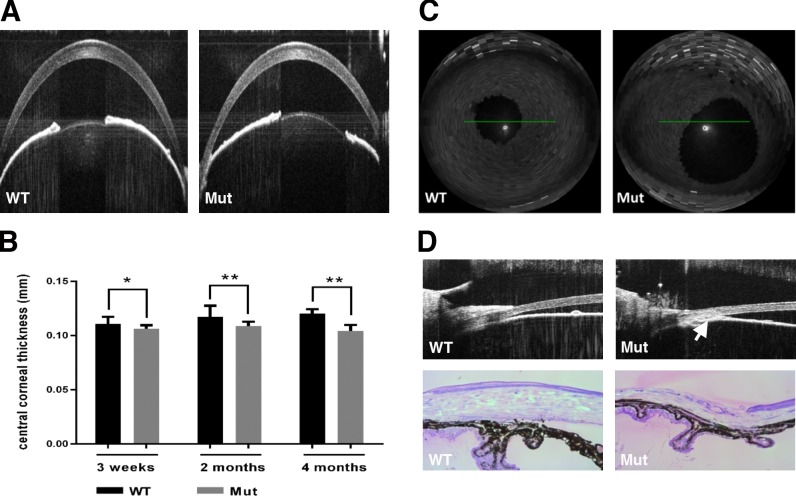
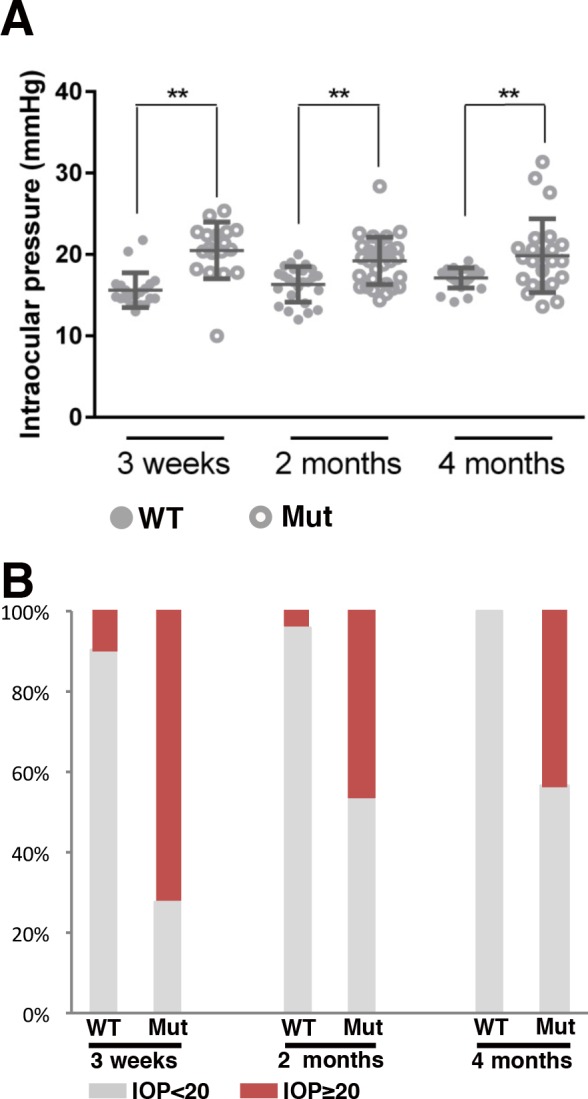
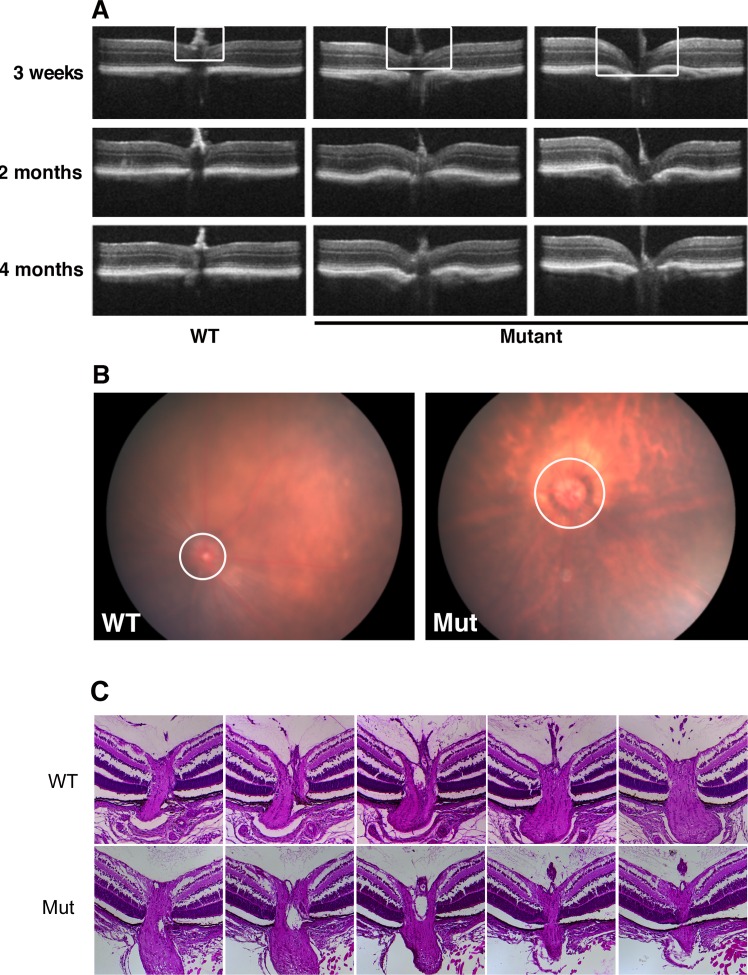
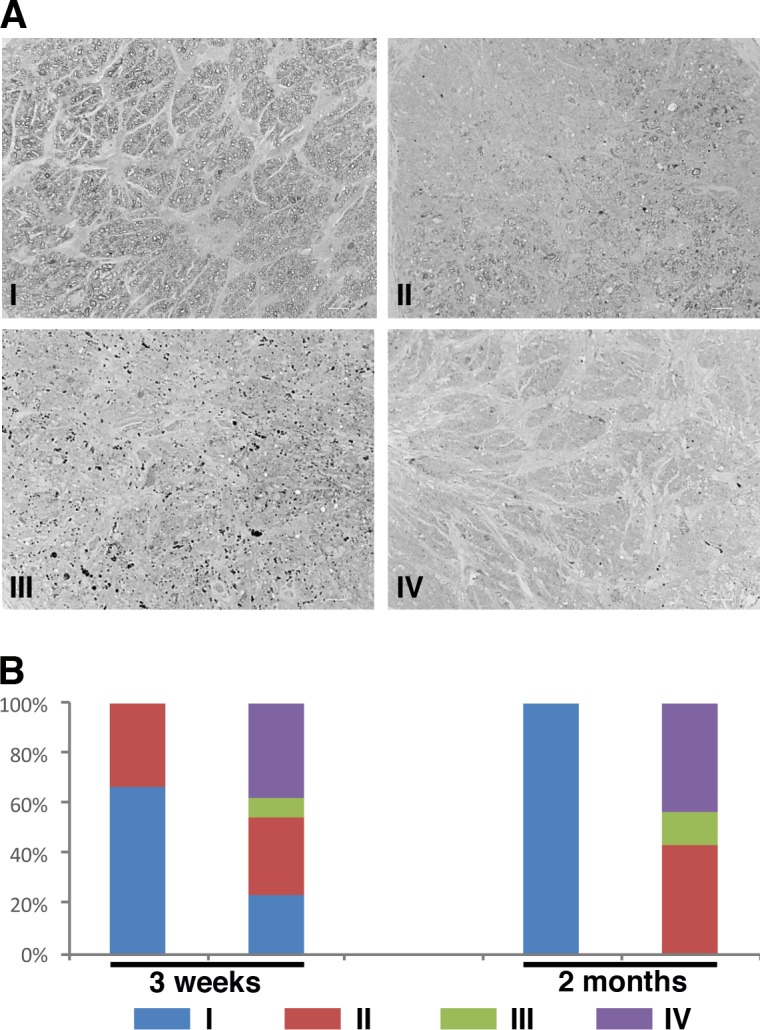
Methods: Eyes of Pitx2+/- and wild-type littermates were examined clinically using optical coherence tomography (OCT) and fundus photography. Intraocular pressures were measured using a TonoLab rebound tonometer. Eyes were examined histologically to assess PITX2 expression, structural integrity, and optic nerve and ganglion cell content.

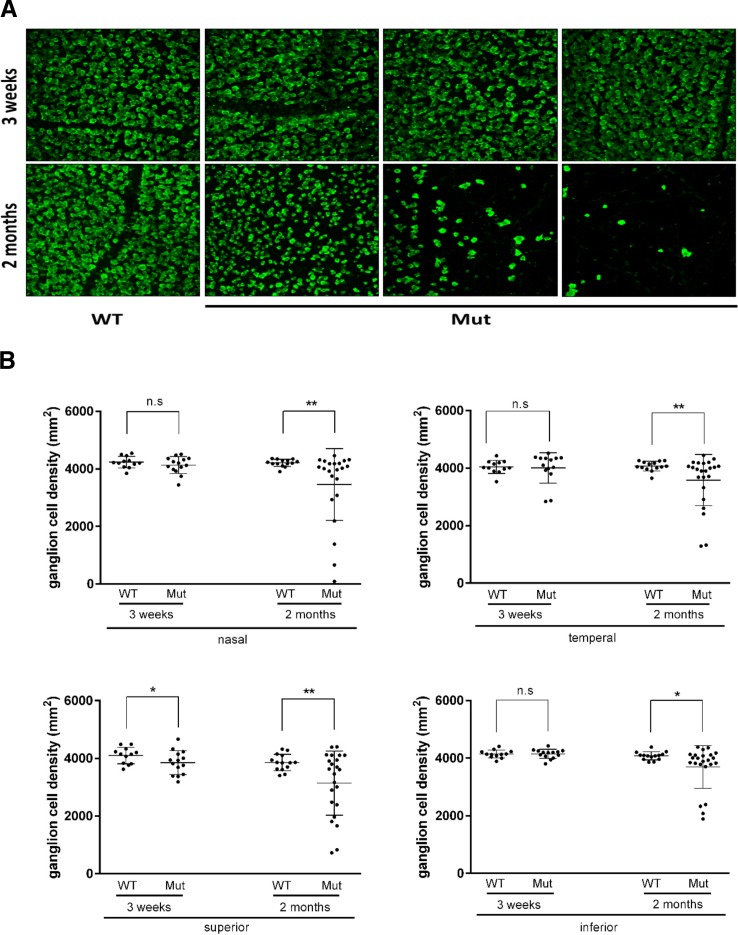
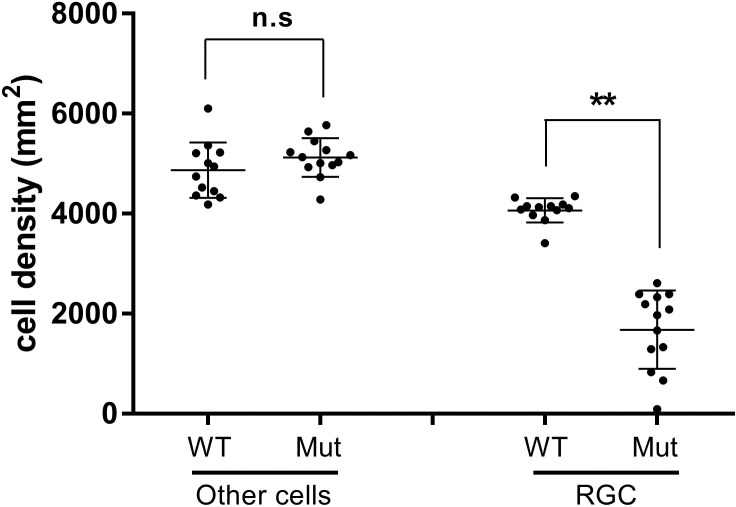
Results: PITX2 is present postnatally in the corneal endothelium and stroma, iris stroma, trabecular meshwork, and Schlemm's canal. Reduced central corneal thickness, iris defects, and iridicorneal adhesions are all prevalent in Pitx2+/- eyes. Although optic nerve heads appear normal at postnatal day 7, IOP is elevated and optic nerve head cupping is fully penetrant in Pitx2+/- eyes by 3 weeks of age. Neurodegeneration is present in a significant percentage of optic nerves from Pitx2+/- mice by 3 weeks of age, and is fully penetrant by 2 months of age. Pitx2+/- eyes show significant reductions in specifically ganglion cell density in all four quadrants by 2 months of age.

Conclusions: Pitx2+/- mice model the major ocular features of Axenfeld-Rieger Syndrome and will be an important resource for understanding the molecular mechanisms leading to anterior segment dysgenesis and a high prevalence of glaucoma in this disease. In addition, these mice may provide an efficient new model for assessing the molecular events in glaucoma more generally, and for developing and testing new treatment paradigms for this disease.


Figures

Figure 1
Figure 1
Morphologic changes in anterior segments were found in Pitx2+/− mice. (A) Two representative OCT images showed CCT in wild-type (WT) and Pitx2+/− eyes 2 months of age. (B) Quantification revealed an increasing reduction in CCT at 3 weeks (4.2%; N = 18 WT vs. 14 mutant), 2 months (7.4%; N = 24 WT vs. 31 mutant), and 4 months (13%; N = 23 WT vs. 26 mutant) in Pitx2+/− mice eyes. Error bars represent SD. (C) Approximately 50% pupils are displaced/enlarged in Pitx2+/− mice. (D) Anterior synechiae in 2-month-old Pitx2+/− eyes was shown either by OCT imaging (upper panel, indicated by red arrow) or histology. Significance: * P ≤ 0.05; ** P ≤ 0.01.
Figure 2
Figure 2
Intraocular pressure analysis in the controls and Pitx2+/− mice. (A) Individual IOP values from the time points indicated were shown by dot plotting. Means ± SD are also included. Solid circles represent the values from wild type and hollow circles represent the values from Pitx2+/−. The mean of IOP values in control eyes was 15.62 (n = 20), 15.9 (n = 25), and 16.98 (n = 25) at 3 weeks, 2, and 4 months, respectively. The mean IOP values for Pitx2+/− eyes at 3 weeks, 2, and 4 months of age were 20.5 (n = 18), 18.8 (n = 32), and 20.1 (n = 23), respectively. ** indicates the difference is significant (P ≤ 0.01). (B) Intraocular pressure data are presented by stacked column plotting, showing the percentage of each group at different time points.
Figure 3
Figure 3
Defects of optic nerve head were identified in Pitx2+/− mice. (A) Eyes from WT and mutant mice were imaged by SD-OCT for morphology of the optic nerve head at the ages indicated. White rectangle indicates the region of optic nerve head, where it is flat at all time points in wild type, but cupped with varying severity in the mutants. (B) Fundus photography at 2 months also showed morphology of optic nerve head (circle) changed in the mutant eyes. (C) Representative examples of histologic sections taken through nerve heads from a Pitx2+/+ and a Pitx2+/− eye at postnatal day 7, illustrating the absence of cupping in the heterozygous eyes.
Figure 4
Figure 4
Optic nerve degeneration in Pitx2+/− mice was identified by PPD staining. (A) Representative images of optic nerves from WT and mutant eyes at 2-months old following staining with PPD to visualize the myelin sheath. Optic nerves were assigned to one of four categories based on the severity of degeneration identified: (1) the majority of axons were healthy, (2) partial degeneration was identified regionally, (3) no healthy axons were seen but dying axons were still identifiable, and (4) all axons, including dying ones, were missing. Each type was indicated by a representative image. (B) Samples from 3-week-old (WT N = 12; mutant N = 13) and 2-month-old (WT N = 8; mutant N = 14) optic nerves were scored based on the severity assignment described previously. At 2 months old, all optic nerves from wild type were healthy and assigned to type I. Degeneration was found in all optic nerves from the mutants with vary severity at 2 months of age, even the density of retinal ganglion cells was normal in the corresponding retinas.
Figure 5
Figure 5
Retinal ganglion cell density is reduced in Pitx2+/− mice. (A) Flat-mounted retinas from 3 weeks, 2, and 4 months were stained with anti-RBPMS antibody, which can recognize specifically RGCs. Representative images from 3-weeks and 2-months old were presented to show fewer retinal ganglion cells in Pitx2+/− eyes. At the age of 3 weeks, there was no visible changes in RGC density. However, at the age of 2 months, RGC loss was readily seen with vary severity. (B) Retinal ganglion cell density data were analyzed by dot plotting with mean value plus ± SD. Each retina was divided into four areas: nasal, temporal, superior, and inferior. Significance: * P ≤ 0.05; ** P ≤ 0.01.
Figure 6
Figure 6
Displaced amacrine cell density is unaffected in PItx2+/− mice. Comparison of Nonganglion cell densities (other cells) to ganglion cell densities in selected Pitx2+/+ versus Pitx2+/− retinas. Images (N = 13) from Pitx2+/− retinas exhibiting a ≥35% ganglion cell loss of were identified and the density of nonganglion cells “other cells” was deduced by determining the total number of DAPI+ nuclei and subtracting the number of RBPMS+ cells. “Other cells” densities from control images (N = 12) were determined in parallel. “Other cells” are presumed to represent displace amacrine cells, as they constitute the vast majority of nonganglion cells in the ganglion cell layer. Data are presented by dot plot with mean values ± SD. Significance: n.s., not significant; ** P ≤ 0.01.

Similar articles

Cited by

References

    1. Tham YC,, Li X,, Wong TY,, Quigley HA,, Aung T,, Cheng CY. Global prevalence of glaucoma and projections of glaucoma burden through 2040: a systematic review and meta-analysis. Ophthalmology. 2014; 121: 2081–2090. - PubMed
    1. King A,, Azuara-Blanco A,, Tuulonen A. Glaucoma. BMJ. 2013; 346: f3518. - PubMed
    1. Mantravadi AV,, Vadhar N. Glaucoma. Prim Care. 2015; 42 (3): 437–449. - PubMed
    1. Heijl A,, Leske MC,, Bengtsson B,, Hyman L,, Hussein M. Reduction of intraocular pressure and glaucoma progression: results from the Early Manifest Glaucoma Trial. Arch Ophthalmol. 2002; 120: 1268–1279. - PubMed
    1. Quigley HA. Open-angle glaucoma. N Engl J Med. 1993; 328: 1097–1106. - PubMed

LinkOut - more resources