. 2016 Nov;15(11):3348-3360.
doi: 10.1074/mcp.M116.062539. Epub 2016 Sep 21.

The Primary Effect on the Proteome of ARID1A-mutated Ovarian Clear Cell Carcinoma is Downregulation of the Mevalonate Pathway at the Post-transcriptional Level

Affiliations

The Primary Effect on the Proteome of ARID1A-mutated Ovarian Clear Cell Carcinoma is Downregulation of the Mevalonate Pathway at the Post-transcriptional Level

Aaron R Goldman et al. Mol Cell Proteomics. 2016 Nov.

Abstract

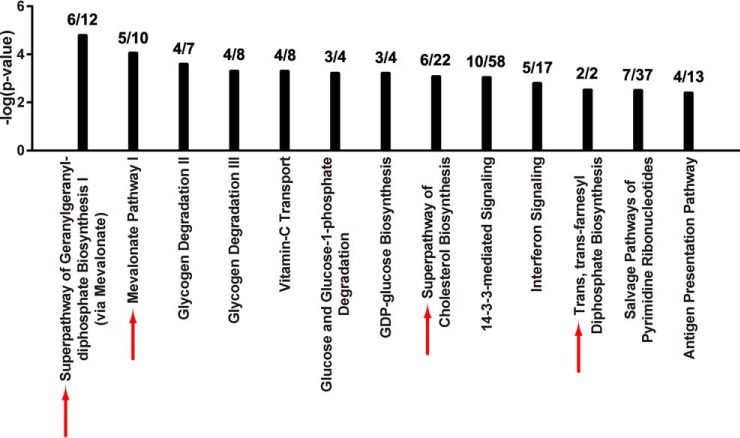
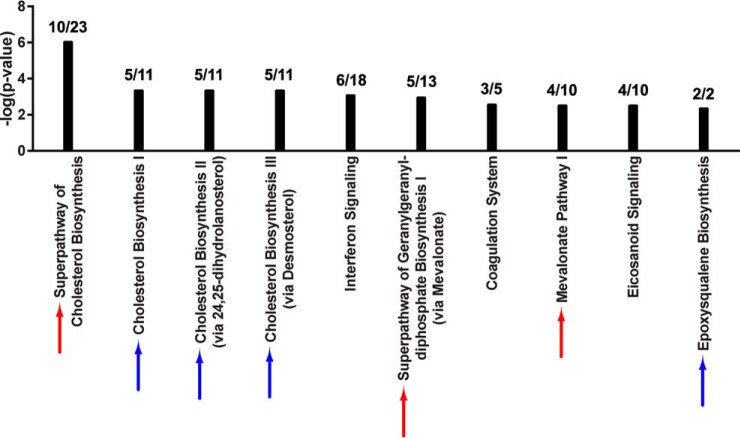
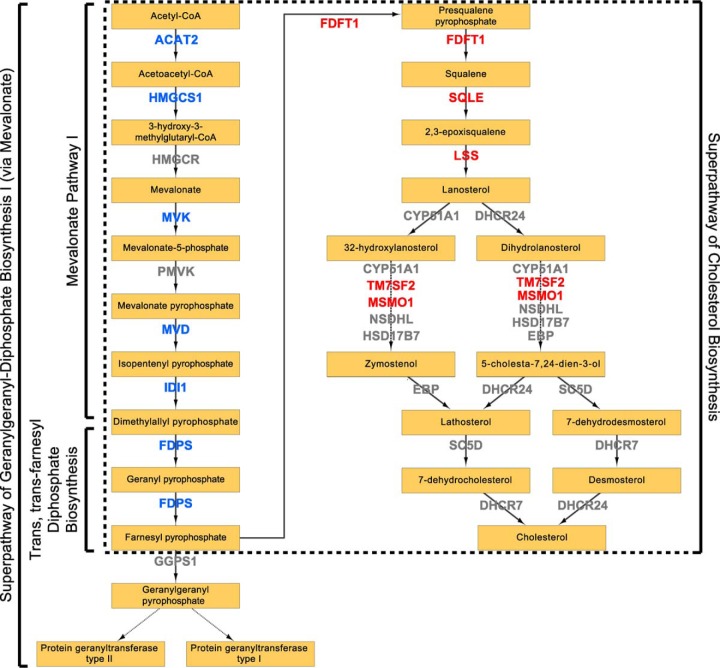
Inactivating mutations in ARID1A, which encodes a subunit of the SWI/SNF chromatin-remodeling complex, are found in over half of ovarian clear cell carcinoma cases and more broadly across most types of cancers. To identify ARID1A-dependent changes in intracellular signaling pathways, we performed proteome analyses of isogenic ovarian clear cell carcinoma cell lines with or without ARID1A expression. Knockout of ARID1A in an ovarian clear cell carcinoma cell line with wild-type ARID1A, OVCA429, primarily resulted in downregulation of the mevalonate pathway, an important metabolic pathway involved in isoprenoid synthesis, cholesterol synthesis, and other downstream pathways. In a complementary experiment, expression of wild-type ARID1A in an ovarian clear cell carcinoma cell line containing mutated ARID1A, OVISE, affected the mevalonate pathway in a reciprocal manner. A striking aspect of these analyses was that, although only 5% of the detected proteome showed significant abundance changes, most proteins in the mevalonate pathway were coordinately affected by ARID1A status. There were generally corresponding changes when comparing the proteomics data to our previously published microarray data for ectopic expression of ARID1A in the OVISE cell line. However, ARID1A-dependent changes were not detected for genes within the mevalonate pathway. This discrepancy suggests that the mevalonate pathway is not regulated directly by ARID1A-mediated transcription and may be regulated post-transcriptionally. We conclude that ARID1A status indirectly influences the mevalonate pathway and probably influences other processes including glycogen metabolism and 14-3-3-mediated signaling. Further, our findings demonstrate that changes in mRNA levels are sometimes poor indicators of signaling pathways affected by gene manipulations in cancer cells.


Figures

Fig. 1.
Fig. 1.
Characterization of the OVCA429 proteome with or without ARID1A CRISPR knockout. A, Two-way, unsupervised hierarchical clustering of OVCA429 proteomes with and without ARID1A knockout based on LFQ intensities. B, Volcano plot comparing ARID1A knockout and control proteomes. Log ratios of LFQ intensities in ARID1A knockout versus control were plotted against negative log p values from the Student's t test based on biological triplicates. Vertical lines: fold-changes of ± 2. Horizontal line: Student's t test p of 0.05. Blue points: proteins that meet both criteria for significant change between ARID1A knockout and control (i.e. fold-change in abundance > 2 and p < 0.05). Gray points: proteins that do not meet both of these criteria.
Fig. 2.
Fig. 2.
Knockout of ARID1A downregulates the mevalonate pathway. Top scoring canonical pathways associated with ARID1A knockout in OVCA429 are shown (IPA, p < 0.005 by Fisher's exact test right-tailed). Black bars: negative log p values for each canonical pathway. The ratio of annotated proteins that significantly changed in level in ARID1A knockout to total identified proteins for a given canonical pathway is shown above each bar. Red arrows: canonical pathways that include the mevalonate pathway and are also significantly enriched among proteins that changed upon ARID1A induction. Refer to Fig. 4.
Fig. 3.
Fig. 3.
Characterization of the OVISE proteome with or without induction of wild-type ARID1A expression. A, Two-way, unsupervised hierarchical clustering of OVISE proteomes based on LFQ intensities. B, Volcano plot comparing proteomes from ARID1A-induced cells and control cells. Log ratios of LFQ intensities in ARID1A induction versus control were plotted against negative log p values from the Student's t test based on biological triplicates. Vertical lines: fold-changes of ± 2. Horizontal line: Student's t test p of 0.05. Blue points: proteins that meet both criteria for significant change between ARID1A induction and control (i.e. fold-change in abundance > 2 and p < 0.05). Gray points: proteins that do not meet both of these criteria.
Fig. 4.
Fig. 4.
Induction of ARID1A up-regulates the mevalonate pathway. Top scoring canonical pathways associated with ARID1A restoration in OVISE are shown (IPA, p < 0.005 by Fisher's exact test right-tailed). Black bars: negative log p values for each canonical pathway. The ratio of annotated proteins that significantly changed in level following ARID1A induction to total identified proteins for a given canonical pathway is shown above each bar. Red arrows: canonical pathways that involve the mevalonate pathway and are also significantly enriched among proteins that changed due to ARID1A knockout. Refer to Fig. 2. Blue arrows: additional canonical pathways involving the mevalonate pathway.
Fig. 5.
Fig. 5.
Regulation of mevalonate pathway by ARID1A. Schematic diagram of mevalonate pathway based on IPA curation. Canonical pathways overrepresented upon ARID1A knockout in OVCA429 and induction in OVISE are labeled. Blue: enzymes significantly decreased in abundance in knockout and significantly increased in abundance in induction. For enzymes that significantly changed in one condition, we allowed for a slightly relaxed fold change in the other condition (i.e. 1.8-fold change with Student's t test p < 0.05). Red: enzymes significantly increased in abundance in induction and not significantly changed in knockout. Refer to Table I.

Similar articles

Cited by

References

    1. Siegel R. L., Miller K. D., and Jemal A. (2016) Cancer statistics, 2016. CA Cancer J. Clin. 66, 7–30 - PubMed
    1. Itamochi H., Kigawa J., and Terakawa N. (2008) Mechanisms of chemoresistance and poor prognosis in ovarian clear cell carcinoma. Cancer Sci. 99, 653–658 - PMC - PubMed
    1. Pectasides D., Pectasides E., Psyrri A., and Economopoulos T. (2006) Treatment issues in clear cell carcinoma of the ovary: a different entity? Oncologist 11, 1089–1094 - PubMed
    1. Kurman R. J., and Shih Ie M. (2008) Pathogenesis of ovarian cancer: lessons from morphology and molecular biology and their clinical implications. Int. J. Gynecol. Pathol. 27, 151–160 - PMC - PubMed
    1. Yamaguchi K., Mandai M., Oura T., Matsumura N., Hamanishi J., Baba T., Matsui S., Murphy S. K., and Konishi I. (2010) Identification of an ovarian clear cell carcinoma gene signature that reflects inherent disease biology and the carcinogenic processes. Oncogene 29, 1741–1752 - PubMed

MeSH terms