. 2016 Sep 22:6:33823.
doi: 10.1038/srep33823.

Cyclooxygenase-2 induced β1-integrin expression in NSCLC and promoted cell invasion via the EP1/MAPK/E2F-1/FoxC2 signal pathway

Affiliations

Cyclooxygenase-2 induced β1-integrin expression in NSCLC and promoted cell invasion via the EP1/MAPK/E2F-1/FoxC2 signal pathway

Jinshun Pan et al. Sci Rep. .

Abstract

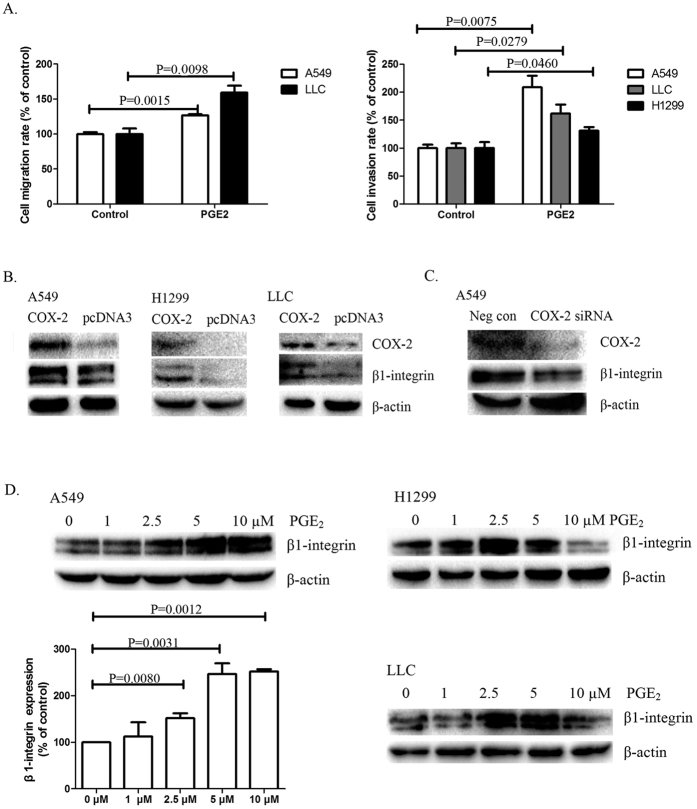
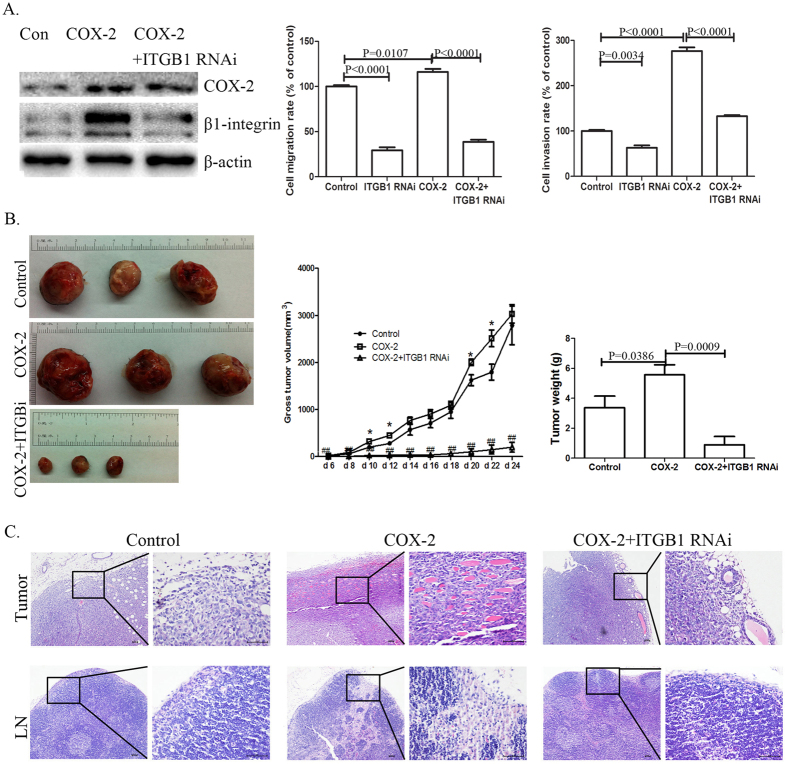
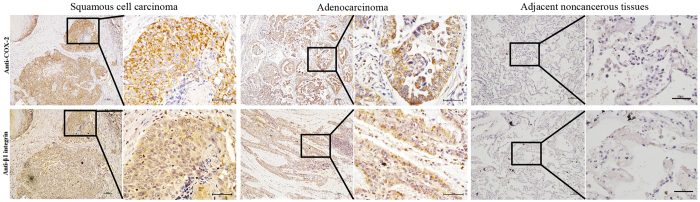
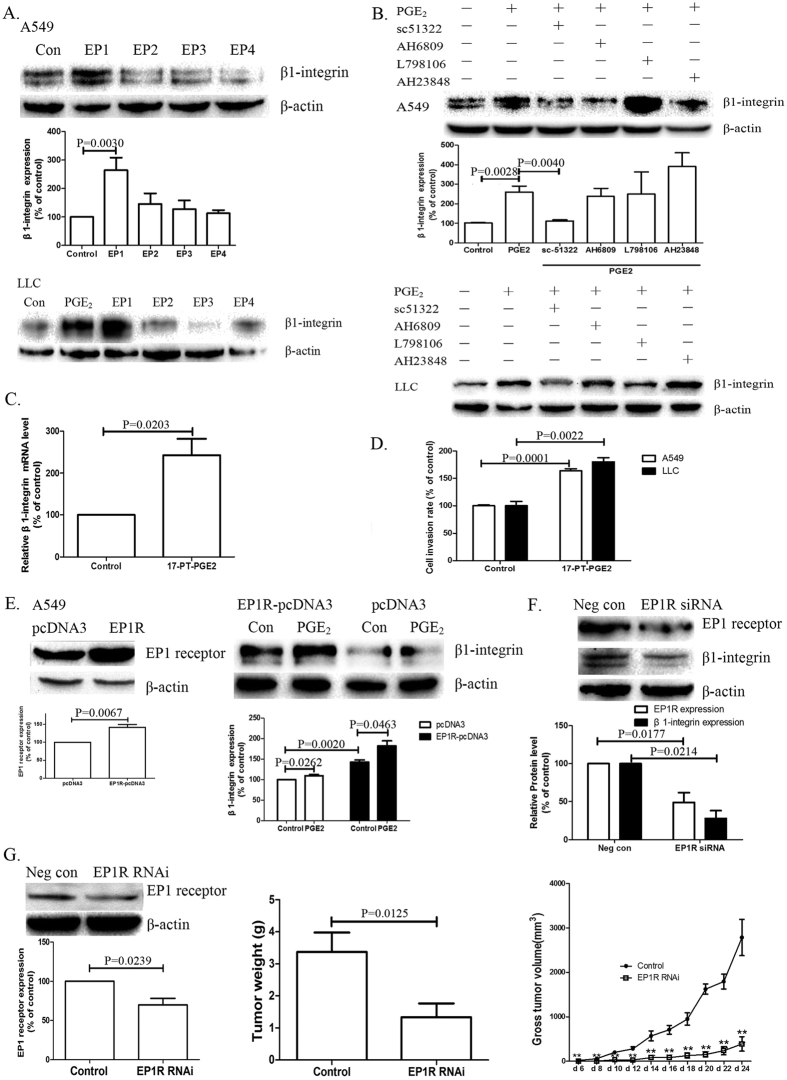
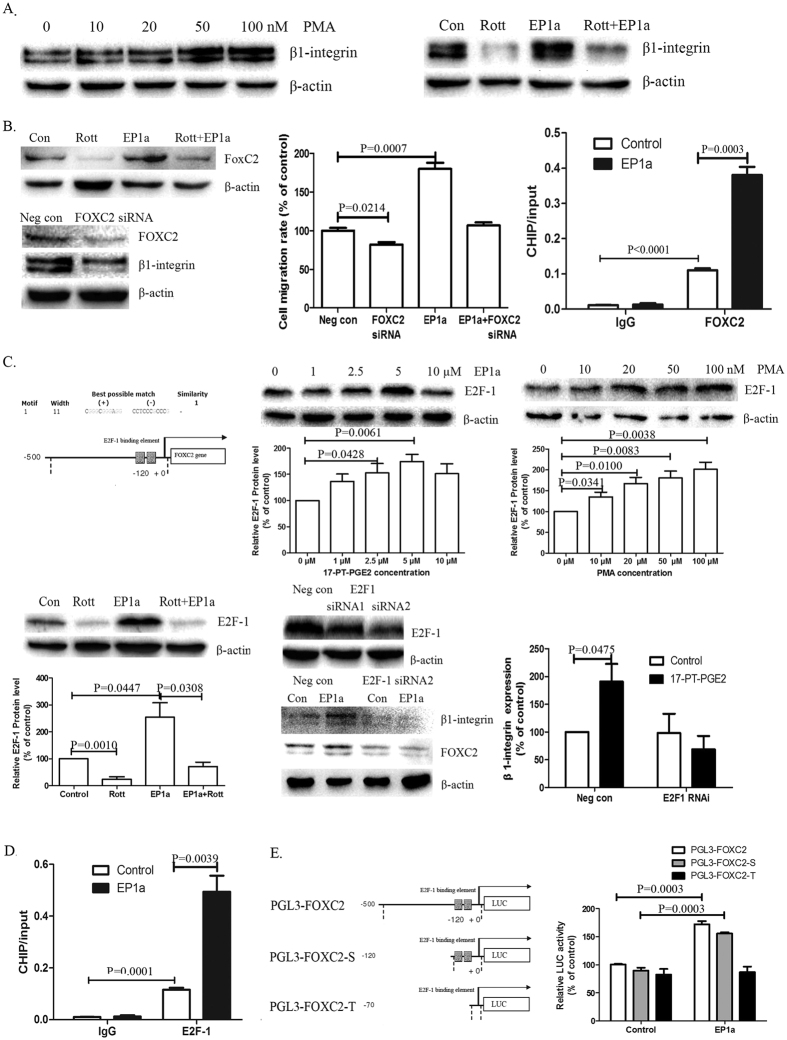
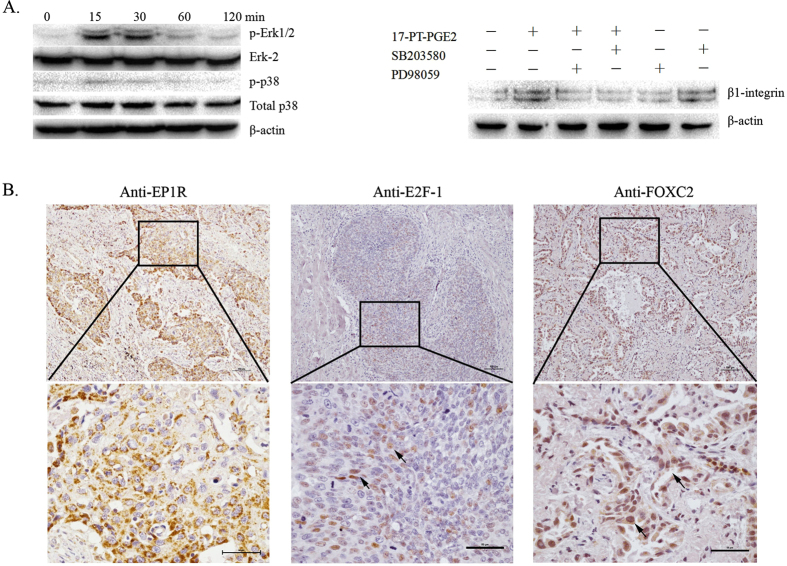
Cyclooxygenase-2 (COX-2) has been implicated in cell invasion in non-small-cell lung cancer (NSCLC). However, the mechanism is unclear. The present study investigated the effect of COX-2 on β1-integrin expression and cell invasion in NSCLC. COX-2 and β1-integrin were co-expressed in NSCLC tissues. COX-2 overexpression or Prostaglandin E2 (PGE2) treatment increased β1-integrin expression in NSCLC cell lines. β1-integrin silencing suppressed COX-2-mediated tumour growth and cancer cell invasion in vivo and in vitro. Prostaglandin E Receptor EP1 transfection or treatment with EP1 agonist mimicked the effect of PGE2 treatment. EP1 siRNA blocked PGE2-mediated β1-integrin expression. EP1 agonist treatment promoted Erk1/2, p38 phosphorylation and E2F-1 expression. MEK1/2 and p38 inhibitors suppressed EP1-mediated β1-integrin expression. E2F-1 silencing suppressed EP1-mediated FoxC2 and β1-integrin upregulation. ChIP and Luciferase Reporter assays identified that EP1 agonist treatment induced E2F-1 binding to FoxC2 promotor directly and improved FoxC2 transcription. FoxC2 siRNA suppressed β1-integrin expression and EP1-mediated cell invasion. Immunohistochemistry showed E2F-1, FoxC2, and EP1R were all highly expressed in the NSCLC cases. This study suggested that COX-2 upregulates β1-integrin expression and cell invasion in NSCLC by activating the MAPK/E2F-1 signalling pathway. Targeting the COX-2/EP1/PKC/MAPK/E2F-1/FoxC2/β1-integrin pathway might represent a new therapeutic strategy for the prevention and treatment of this cancer.


Figures

Figure 1
Figure 1. COX-2 promotes β1-integrin expression in NSCLC cells.
(A) Effects of PGE2 on cell migration and invasion in NSCLC cells. The cell migration and invasion assays were performed in 12-well transwell units. A549, LLC and H1299 cells were treated with 5 μM PGE2. Results are presented as the mean ± SEM (n = 3). (B) Effects of COX-2 overexpression on β1-integrin regulation in NSCLC cells. A549, H1299 and LLC cells were transfected with COX2-pcDNA3 plasmid or empty pcDNA3 plasmid. Total protein was isolated and visualized using anti-β1-integrin and anti-COX-2 antibodies. Levels of β-actin served as a loading control. (C) Effects of COX-2 RNAi on β1-integrin regulation in NSCLC cells. A549 cells were transfected with an EP1R-siRNA. After 72 h, total protein was isolated and visualized using anti-β1-integrin and anti-COX-2 antibodies. Levels of β-actin served as a loading control. (D) Effects of PGE2 treatment on β1-integrin expression in NSCLC cells. A549 cells were treated with PGE2 at various concentrations for 24 h. Total protein was isolated and visualized using anti-β1-integrin antibody. Levels of β-actin served as a loading control. Results are presented as the mean ± SEM (n = 3). Similar effects were shown in LLC and H1299 cells. These experiments were performed three times with similar results.
Figure 2
Figure 2. β1-integrin is involved in COX-2-induced tumour growth and cell invasion in NSCLC.
(A) Effects of β1-integrin expression on COX-2-induced cell migration and invasion in LLC cells. COX-2-transfected LLC cells were infected with lentivirus silencing the β1-integrin expression (termed COX-2 + ITGB1 RNAi cells). Total protein was isolated and visualized using anti-β1-integrin and anti-COX-2 antibodies. Levels of β-actin served as a loading control. The cell migration and invasion assays were performed in LLC control cells, ITGB1 RNAi cells, COX-2 overexpression cells and COX-2 + ITGB1 RNAi cells. Results are presented as the mean ± SEM (n = 3). (B) Effects of β1-integrin expression on COX-2-induced tumour growth and cell invasion in xenograft models. Four-week-old female C57/B6 mice were randomized into three groups (n = 8). Group 1 was implanted with wild-type LLC cells (control group). Group 2 was implanted with COX-2 overexpression cells. Group 3 was implanted with COX-2 + ITGB1 RNAi cells. Representative images of tumours from each group were shown. The tumour growth curve and a comparison of average tumour weight on the final day among three groups are shown. (C) HE staining of tumours and adjacent lymph nodes (LN) sections showing histopathological features of the xenografts in mice. Scale bars = 100 μm (10×). Scale bars = 50 μm (40×).
Figure 3
Figure 3. The expression of COX-2 and β1-integrin in NSCLC cancer tissues and adjacent noncancerous tissues.
Representative immunohistochemical images of lung squamous cell carcinoma tissues, adenocarcinoma tissues and adjacent noncancerous tissues stained with the anti-human COX-2 and β1-integrin antibodies. Scale bars = 100 μm (10×). Scale bars = 50 μm (40×). The integrated grey level was carried out using Q-Win software. Statistical analysis of integrated grey levels of 80 samples was performed using STATA se12.0 software. β1-integrin and COX-2 comparisons between NSCLC and control tissue groups were analysed by Shapiro–Wilk’s W test. Spearman’s correlation assay showed that β1-integrin and COX-2 expression displayed significant positive correlations, both in the squamous cell carcinoma samples (Spearman’s rho = 0.789, P < 0.01) and in the adenocarcinoma samples (Spearman’s rho = 0.634, P < 0.01).
Figure 4
Figure 4. EP1 receptor is involved in COX-2-induced β1-integrin expression in NSCLC.
(A) Effects of EP agonists on β1-integrin expression in NSCLC cells. A549 cells were exposed to 5 μM agonists for EP1 (17-PT-PGE2), EP2 (butaprost), EP3 (sulprostone) and EP4 (PGE1 alcohol) for 24 h, respectively. (B) Effects of EP antagonists on PGE2-mediated β1-integrin expression in NSCLC cells. A549 cells were pre-treated with various EP antagonists for 1 h, followed by PGE2 for 24 h (antagonists for EP1 (sc15322), EP2 (AH6809), EP3 (L-798106) and EP4 (AH23848)). Similar effects were observed in LLC cells. (C) The effect of EP1 agonist on β1-integrin transcription in A549 cells. Total RNA was isolated, and real-time PCR analysis was performed. GAPDH served as a loading control. Results are shown as the mean ± SEM (n = 3). (D) Effects of EP1 agonist on NSCLC cell invasion. Results are presented as the mean ± SEM (n = 3). (E) Effects of EP1R overexpression on β1-integrin regulation in NSCLC cells. EP1R-transfected A549 cells were exposed to PGE2 for 24 h. Results are presented as the mean ± SEM (n = 3). (F) Effects of EP1R RNAi on β1-integrin regulation in NSCLC cells. A549 cells were transfected with an EP1R-siRNA. Results are presented as the mean ± SEM (n = 3). (G) Effects of EP1R expression on tumour growth in xenograft models. LLC cells were infected with lentivirus silencing EP1R expression (termed EP1R RNAi cells). Four-week-old female C57/B6 mice were randomized into two groups (n = 8). Group 1 was implanted with wild-type LLC cells (control group). Group 2 was implanted with EP1R RNAi cells. Representative images of tumours from each group, the tumour growth curve and a comparison of average tumour weight on the final day between two groups are shown.
Figure 5
Figure 5. PKC/E2F-1/FoxC2 is involved in EP1R-induced β1-integrin expression in NSCLC.
(A) Effects of PKC activation on β1-integrin expression in NSCLC cells. A549 cells were treated with PKC activator PMA for 24 h. A549 cells were pre-treated with PKC inhibitor Rottlerin for 1 h, followed by EP1 agonist (EP1a) for 24 h. These experiments were performed three times with similar results. (B) Effects of FoxC2 on EP1R-mediated β1-integrin expression in NSCLC cells. A549 cells were pre-treated with Rottlerin for 1 h, followed by EP1 agonist (EP1a) for 24 h. A549 cells were transfected with a FoxC2-siRNA, and then the cells were treated with 17-PT-PGE2 5 μM. The cell migration assays were performed in 12-well transwell units. Results are presented as the mean ± SEM (n = 3). ChIP assays were performed using anti-FoxC2 antibodies and anti-IgG, and followed by analyse of realtime-PCR. Results are presented as the mean ± SEM (n = 3). (C) The sequences of the human FoxC2 promoter were analysed in detail by the Motif Alignment & Search Tool. The putative E2F-1 binding element is located in the human FoxC2 promoter region. A549 cells were treated by EP1a or PMA at various concentrations. A549 cells were pre-treated with Rottlerin for 1 h, followed by EP1a for 24 h. Results are presented as the mean ± SEM (n = 3). A549 cells were transfected with E2F-1-siRNAs. A549 E2F-1-siRNA cells were exposed to EP1a for 24 h. Results are presented as the mean ± SEM (n = 3). (D) ChIP assays were performed using anti-E2F-1 antibodies and anti-IgG, and followed by analyse of realtime-PCR. Results are presented as the mean ± SEM (n = 3). (E) Effects of E2F-1 on FoxC2 transcription activity. Schematic diagram of luciferase reporter constructs for the FoxC2 promoter. A549 cells were transfected with wild-type or truncated FoxC2 promoter constructs, followed by EP1a treatment. Luciferase (Luc) activity was measured using the Promega Dual-Luciferase Reporter Assay system. Results are presented as the mean ± SEM (n = 3).
Figure 6
Figure 6. E2F-1 and FoxC2 are highly expressed in NSCLC tissues.
(A) Effects of MAPKs on β1-integrin expression in NSCLC cells. A549 cells were treated with EP1a for various times. A549 cells were pre-treated with inhibitors of MEK (PD98059) or p38 (SB203580) for 1 h, followed by EP1a for 24 h. These experiments were performed three times with similar results. (B) The expression of E2F-1, FoxC2 and EP1R in lung cancer tissues. Representative immunohistochemical images of lung cancer tissues stained with anti-E2F-1, anti-FoxC2 and anti-EP1R antibodies. Scale bars = 100 μm (10×). Scale bars = 50 μm (40×).

Similar articles

Cited by

References

    1. Forman D. & Ferlay J. The global and regional burden of cancer. In: Stewart B. W., Wild C. P., Editors. World Cancer Report 2014. Lyon: International agency for research on cancer 26–69 (2014).
    1. Siegel R. L., Miller K. D. & Jemal A. Cancer statistics, 2015. CA. Cancer J. Clin. 65, 5–29 (2015). - PubMed
    1. Siegel R., Ma J., Zou Z. & Jemal A. Cancer statistics, 2014. CA. Cancer J. Clin. 64, 9–29 (2014). - PubMed
    1. Siegel R., Naishadham D. & Jemal A. Cancer statistics, 2013. CA. Cancer J. Clin. 63, 11–30 (2013). - PubMed
    1. Mehran R. J. Lung cancer: an update on current surgical strategies. Tex. Heart Inst. J. 39, 844–845 (2013). - PMC - PubMed