. 2016 Sep 22:6:33830.
doi: 10.1038/srep33830.

Mitochondrial pathogenic mechanism and degradation in optineurin E50K mutation-mediated retinal ganglion cell degeneration

Affiliations

Mitochondrial pathogenic mechanism and degradation in optineurin E50K mutation-mediated retinal ganglion cell degeneration

Myoung Sup Shim et al. Sci Rep. .

Erratum in

Abstract

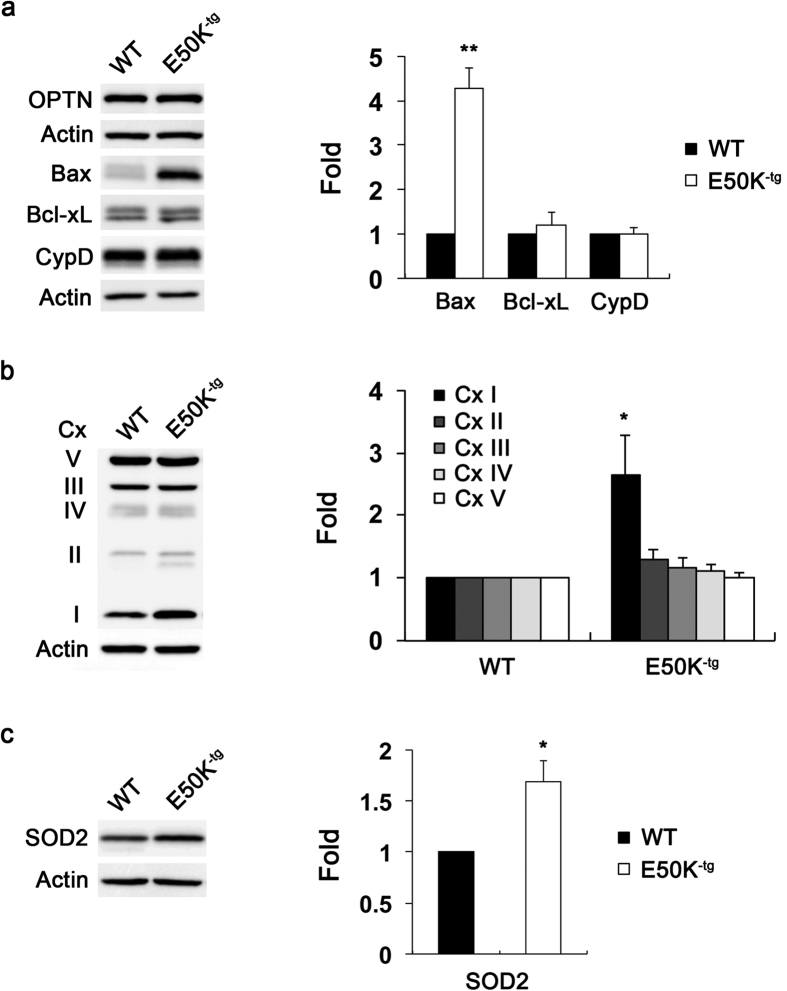
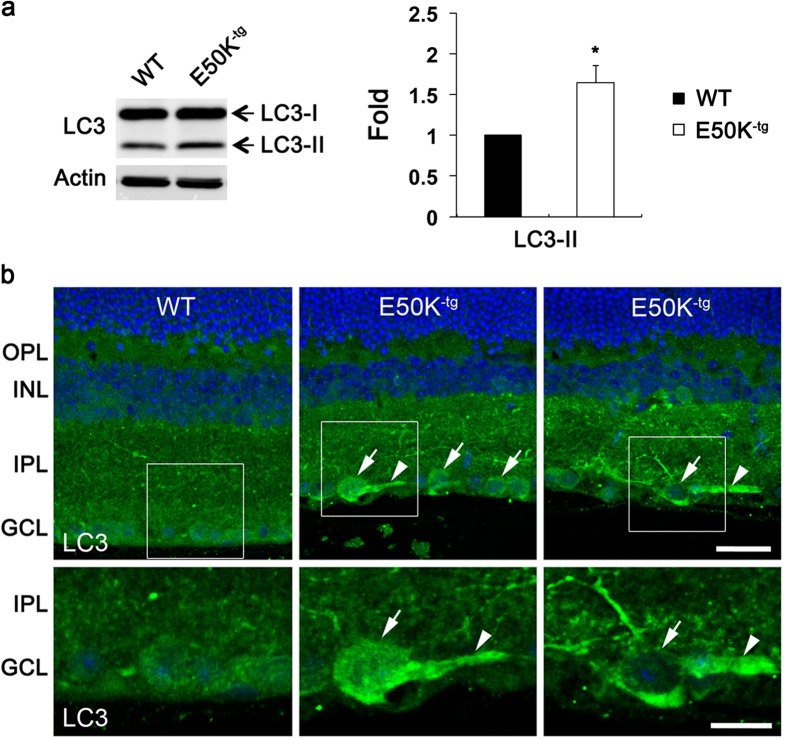
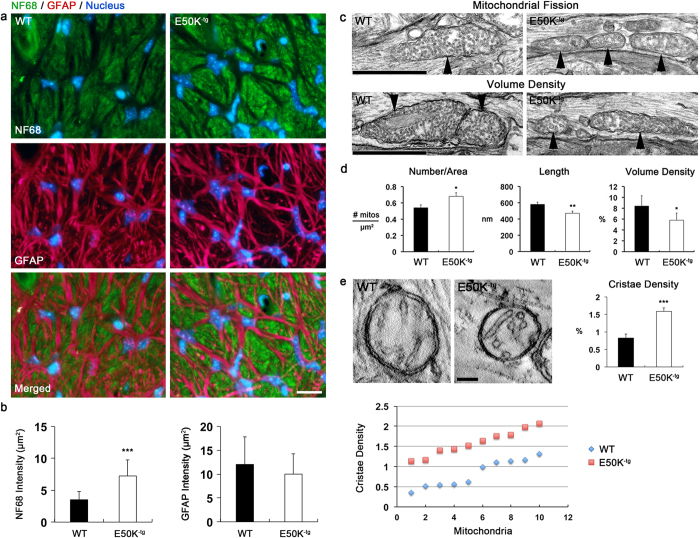
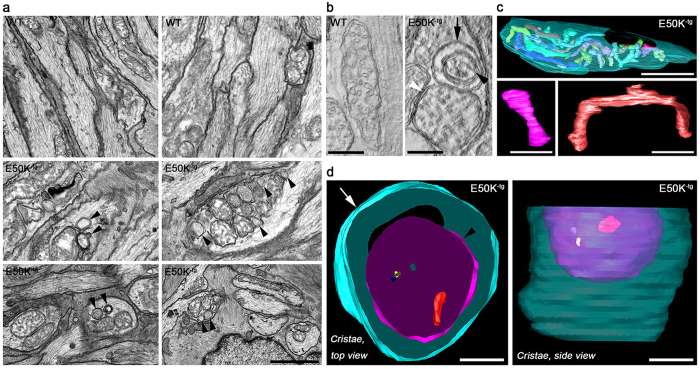
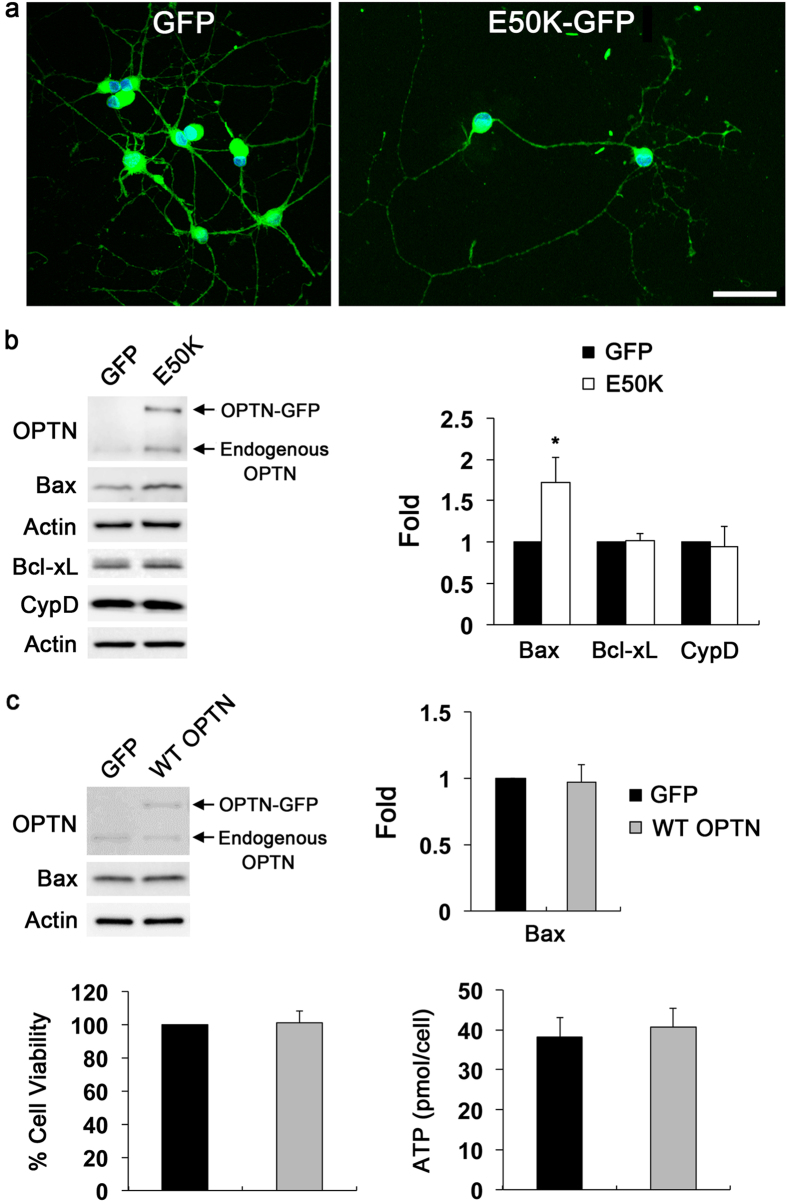
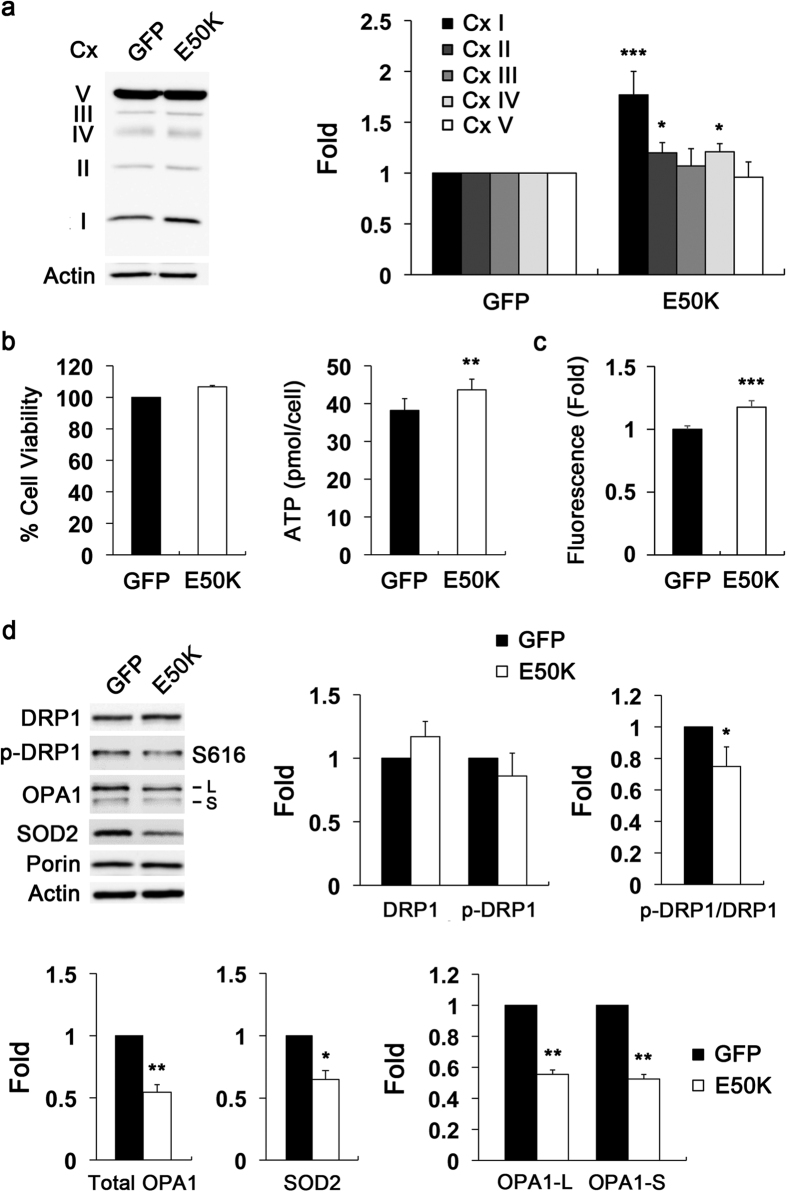
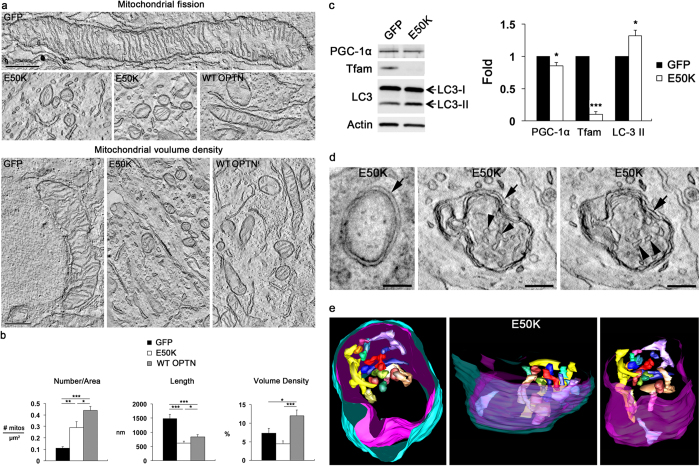
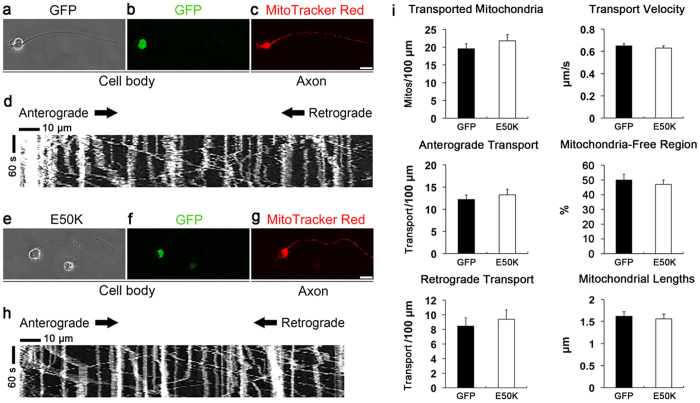
Mutations in optineurin (OPTN) are linked to the pathology of primary open angle glaucoma (POAG) and amyotrophic lateral sclerosis. Emerging evidence indicates that OPTN mutation is involved in accumulation of damaged mitochondria and defective mitophagy. Nevertheless, the role played by an OPTN E50K mutation in the pathogenic mitochondrial mechanism that underlies retinal ganglion cell (RGC) degeneration in POAG remains unknown. We show here that E50K expression induces mitochondrial fission-mediated mitochondrial degradation and mitophagy in the axons of the glial lamina of aged E50K-tg mice in vivo. While E50K activates the Bax pathway and oxidative stress, and triggers dynamics alteration-mediated mitochondrial degradation and mitophagy in RGC somas in vitro, it does not affect transport dynamics and fission of mitochondria in RGC axons in vitro. These results strongly suggest that E50K is associated with mitochondrial dysfunction in RGC degeneration in synergy with environmental factors such as aging and/or oxidative stress.


Figures

Figure 1
Figure 1. Increase of Bax and OXPHOS Cx expression in the retina of aged E50K−tg mice.
(a) Immunoblot analysis of Bax, Bcl-xL, CypD and OPTN protein in retinal extracts from 16-month-old aged E50K−tg mice. (b) Immunoblot analysis of OXPHOS Cx protein in retinal extracts from 16-month-old E50K−tg mice. (c) Immunoblot analysis of SOD2 protein expression in retinal extracts from 16-month-old E50K−tg mice. For each determination, the actin level in age-matched WT mice was normalized to a value of 1.0. Data are shown as the mean ± S.D. (n = 3 independent experiments). *P < 0.05; **P < 0.01 compared with the WT group. Full-length blots are presented in Supplementary Figure 5. CypD, cyclophilin D; Cx, complex; E50K−tg, E50K mutation-carrying transgenic; OPTN, optineurin; SOD2, superoxide dismutase 2; WT, wild-type.
Figure 2
Figure 2. Increase of LC3 protein expression in RGCs and their axons of aged E50K−tg mice.
(a) Immunoblot analysis of LC3 protein in retinal extracts from 16-month-old aged E50K−tg mice. For each determination, the actin level in age-matched WT mice was normalized to a value of 1.0. Data are shown as the mean ± S.D. (n = 3 independent experiments). *P < 0.05 compared with the WT group. Full-length blots are presented in Supplementary Figure 6. (b) Immunohistochemical analysis of LC3 protein expression in retinal sections from WT and E50K−tg mice. Both RGC somas and axons increased LC3 immunoreactivity in E50K−tg mice. Arrows indicate LC3-positive RGC somas in the GCL and arrowheads indicate LC3-positive RGC axons in the GCL. E50K−tg, E50K mutation-carrying transgenic; GCL, ganglion cell layer; INL, inner nuclear layer; IPL, inner plexiform layer; LC3, microtubule-associated protein 1A/1B-light chain 3; OPL, outer plexiform layer; OPTN, optineurin; RGC, retinal ganglion cell; WT, wild-type. Scale bar, 20 μm.
Figure 3
Figure 3. Induction of fission-mediated mitochondrial loss in the axons of the glial lamina in aged E50K−tg mice.
(a,b) Representative images and quantitative immunoreactive intensity analyses from the glial lamina show a significant increase of NF68 immunoreactivity (green) in the axons of 16-month-old aged E50K−tg mice compared with age-matched WT mice. There were no differences in astroglial activation and GFAP immunoreactivity (red) between WT and E50K−tg mice. Blue color indicates nucleus. Scale bar, 20 μm (c) Representative images from TEM analyses show mitochondrial fission and mitochondrial loss in the axons of the glial lamina in 16-month-old aged E50K−tg mice compared with age-matched WT mice. Arrowheads indicate mitochondria. Scale bar, 500 nm. (d) Quantitative TEM analyses of mitochondria show a significant increase of mitochondrial number (n = 20), but decreases of mitochondrial lengths (n = 78 for WT; 92 for E50K−tg mice) and volume density (n = 20) in the axons of the glia lamina of E50K−tg mice. (e) Representative images from TEM analyses show changes in cristae abundance in the mitochondria of the axons in the glial lamina in WT and E50K−tg mice. Quantitative TEM analysis shows a significant increase of mitochondrial cristae density (n = 10 for WT; 10 for E50K−tg mice) in the axons of the glial lamina in E50K−tg mice. Dot graph shows the actual cristae density of each mitochondrion. Data are shown as the mean ± S.E.M. *P < 0.05; **P < 0.01; ***P < 0.001 compared with the WT group. E50K−tg, E50K mutation-carrying transgenic; GFAP, glial fibrillary acidic protein; NF68, neurofilament 68; WT, wild-type. Scale bar, (WT) 500 nm (c), (E50K−tg) 250 nm (c) and (WT and E50K−tg) 100 nm (e).
Figure 4
Figure 4. Formation of autophagosome and mitophagosome in the axons of the glial lamina in aged E50K−tg mice.
(a) Representative images from TEM analyses show several examples of autophagosome formation in the axons of the glial lamina in 16-month-old aged E50K−tg mice compared with age-matched WT mice. Arrowheads indicate formation of autophagosomes in several examples of evulsions showing an increased number of degrading vacuoles and spherical structures with double layer membranes. Scale bar, 500 nm. (b) Electron tomography generated high-resolution 3D reconstructions of mitochondria and mitophagosome formation in the axons of the glial lamina of WT and E50K−tg mice. An example of a degraded small mitochondrion (black arrowhead) engulfed in a mitophagosome (black arrow) is seen in E50K−tg mice. The white arrowhead points to an adjacent mitochondrion that appears abnormal and has been separated from its neighboring larger mitochondrion (not shown) with normal appearance. (c) Surface-rendered views of WT volume segmentation show a normal mitochondrion (transparent cyan outer membrane; cristae of various colors) with numerous well-formed cristae. Typically, the cristae were either tubular (lower left, pink) or branched (lower right, red). (d) An example of a mitophagosome in the axon of the glial lamina in aged E50K−tg mice. Surface-rendered views of volume segmentation show a degraded small mitochondrion (black arrowhead, magenta) engulfed in the mitophagosome (arrow, cyan). The damaged mitochondrion exhibits severe cristae depletion (only 3 very small cristae shown in red, blue and yellow) as seen in the top and side views. The perspective of the volumes occupied by the mitochondrion (purple) and its 3 small cristae inside the mitophagosome is best seen from a side view (right). E50K−tg, E50K mutation-carrying transgenic; WT, wild-type. Scale bar, (WT) 500 nm, (E50K−tg) 250 nm.
Figure 5
Figure 5. Overexpression of E50K promotes Bax protein expression in RGCs in vitro.
(a) Primary RGCs were transduced with AAV2-GFP, AAV2-OPTNWT-GFP or AAV2-OPTNE50K-GFP for 2 days in vitro. Representative images show GFP-positive primary RGCs after transduction. Scale bar, 2 μm. (b) Immunoblot analyses of OPTN, Bax, Bcl-xL and CypD protein in cultured RGCs overexpressing E50K mutant. For each determination, the actin level in control was normalized to a value of 1.0. (b) Immunoblot analyses of OPTN, Bax, Bcl-xL and CypD protein in cultured RGCs overexpressing WT OPTN. For each determination, the actin level in control was normalized to a value of 1.0. Data are shown as the mean ± S.D. (n = 3 independent experiments). *P < 0.05 compared with the control group. Full-length blots are presented in Supplementary Figure 7. CypD, cyclophilin D; GFP, green fluorescent protein; OPTN, optineurin; RGC, retinal ganglion cell; WT, wild-type.
Figure 6
Figure 6. Overexpression of E50K alters OXPHOS Cx system, increases ROS production, and triggers mitochondrial fission and OPA1 loss in RGCs in vitro.
Primary RGCs were transduced with AAV2-GFP or AAV2-OPTNE50K-GFP for 2 days in vitro. (a) Immunoblot analysis of OXPHOS Cx protein in cultured RGCs overexpressing GFP (control) or E50K mutant. (b) Analyses of cell viability using the MTT assay and cellular ATP production using a luciferase-based assay in cultured RGCs overexpressing GFP (control) or E50K mutant. (c) ROS measurement in cultured RGCs overexpressing GFP (control) or E50K mutant. (d) Immunoblot analyses of DRP1, phospho-DRP1 (S616), OPA1, SOD2 and porin protein in cultured RGCs overexpressing GFP (control) or E50K mutant. For each determination, the actin level in the control was normalized to a value of 1.0. Data are shown as the mean ± S.D. (n = 3 independent experiments). *P < 0.05; **P < 0.01; ***P < 0.001 compared with the control group. Full-length blots are presented in Supplementary Figure 8. CypD, cyclophilin D; Cx, complex; DRP1, dynamin-related protein 1; GFP, green fluorescent protein; L, large form; S, small form; OPA1, optic atrophy type 1; OPTN, optineurin; RGC, retinal ganglion cell; ROS, reactive oxygen species; S616, serine 616; SOD2, superoxide dismutase 2.
Figure 7
Figure 7. Overexpression of E50K triggers fission-associated mitochondrial loss and autophagosome and mitophagosome formation in RGC somas in vitro.
Primary RGCs were transduced with AAV2-GFP, AAV2-OPTNE50K-GFP or AAV2-OPTNwt-GFP for 2 days in vitro. (a) Representative images from electron tomography analyses show large-scale fissioning of mitochondria and alteration of mitochondrial volume density in cultured RGC somas overexpressing E50K mutant or WT OPTN. Scale bar, 500 nm. (b) Quantitative electron tomography analyses of mitochondrial number (n = 10), mitochondrial lengths (n = 50) and mitochondrial volume density (n = 10) in cultured RGC somas overexpressing E50K mutant or WT OPTN. Data are shown as the mean ± S.E.M. **P < 0.01; ***P < 0.001 compared with the GFP control group. (c) Immunoblot analyses of SOD2, PGC-1, Tfam and LC3 protein in cultured RGCs overexpressing E50K mutant. For each determination, the actin level in control was normalized to a value of 1.0. Data are shown as the mean ± S.D. (n = 3 independent experiments). *P < 0.05; ***P < 0.001 compared with the control group. Full-length blots are presented in Supplementary Figure 9. (d) Electron tomography generated high-resolution reconstructions of an autophagosome (left, arrow) and a mitophagosome (middle and right, arrows) in cultured RGC somas overexpressing E50K mutant. Arrowheads point to representative cristae. (e) Surface-rendered views of volume segmentation of the mitophagosome shown in panel (d) The mitochondrion (magenta) engulfed in the mitophagosome (cyan) occupies most of the volume of the mitophagosome as seen in this top view (left). The entire complement of cristae found inside the mitochondrion is shown in various colors. All but one of the cristae are aggregated towards one side of the mitochondrion shown in this side view (middle), indicating polarized damage to this mitochondrion. The mitophagosome and mitochondrial outer membranes were made transparent to better see the cristae. Another view with the mitophagosome membrane not shown (right). Only the mitochondrial outer membrane and cristae are seen in this oblique view. GFP, green fluorescent protein; LC3, microtubule-associated protein 1A/1B-light chain 3; OPTN, optineurin; PGC-1α, peroxisome proliferator-activated receptor-γ coactivator (PGC)-1 alpha; RGC, retinal ganglion cell; SOD2, superoxide dismutase 2; Tfam, mitochondrial transcription factor A.
Figure 8
Figure 8. Overexpression of E50K did not alter transport dynamics and lengths of transported mitochondria in cultured RGC axons.
Primary RGCs were transduced with AAV2-GFP or AAV2-OPTNE50K-GFP for 2 days in vitro. In vitro time-lapse imaging shows no significant effects of OPTN E50K mutation on the transport dynamics and lengths of transported mitochondria in the axons of cultured RGCs. (a,b) Representative phase-contrast (a) and fluorescence (b, GFP) images of an RGC with AAV2-GFP focused on the cell body. (c) A representative fluorescence (MitoTracker Red) image of the RGC with AAV-GFP focused on the axon (Supplementary Movie 2). (d) A kymograph (a representation of mitochondrial positions in an axon during the recording time) of the axon in c detected active axonal transport of mitochondria shown as diagonal lines. (e,f) Representative phase-contrast (e) and fluorescence (f, GFP) images of an RGC with AAV2-OPTNE50K-GFP focused on the cell body. (g) A representative fluorescence (MitoTracker Red) image of the RGC with AAV2-OPTNE50K-GFP focused on the axon (Supplementary Movie 3). Scale bar, 20 μm. (h) A kymograph of the axon in (g) detected active axonal transport of mitochondria. (i) No significant effects of the E50K expression were observed in either the number of mitochondria transported in axons (P = 0.36), the anterograde (P = 0.55) and retrograde (P = 0.61) transport, transport velocity (P = 0.32), mitochondria-free regions (P = 0.66), or lengths of transported mitochondria (P = 0.29) in axons. Data are shown as the mean ± S.E.M. GFP, n = 261 mitochondria from 8 axons; and E50K, n = 302 mitochondria from 10 axons. (n = 3 independent experiments). GFP, green fluorescent protein; OPTN, optineurin; RGC, retinal ganglion cell.

Similar articles

Cited by

References

    1. Weinreb R. N. & Khaw P. T. Primary open-angle glaucoma. Lancet 363, 1711–1720 (2004). - PubMed
    1. Zhang K., Zhang L. & Weinreb R. N. Ophthalmic drug discovery: novel targets and mechanisms for retinal diseases and glaucoma. Nat Rev Drug Discov 11, 541–559 (2012). - PubMed
    1. Maruyama H. et al.. Mutations of optineurin in amyotrophic lateral sclerosis. Nature 465, 223–226 (2010). - PubMed
    1. Rezaie T. et al.. Adult-onset primary open-angle glaucoma caused by mutations in optineurin. Science 295, 1077–1079 (2002). - PubMed
    1. Kroeber M., Ohlmann A., Russell P. & Tamm E. R. Transgenic studies on the role of optineurin in the mouse eye. Experimental Eye Research 82, 1075–1085 (2006). - PubMed