. 2016 Oct 13;538(7624):207-214.
doi: 10.1038/nature18299. Epub 2016 Sep 21.

A genomic history of Aboriginal Australia

Anna-Sapfo Malaspinas  1   2   3 Michael C Westaway  4 Craig Muller  1 Vitor C Sousa  2   3 Oscar Lao  5   6 Isabel Alves  2   3   7 Anders Bergström  8 Georgios Athanasiadis  9 Jade Y Cheng  9   10 Jacob E Crawford  10   11 Tim H Heupink  4 Enrico Macholdt  12 Stephan Peischl  3   13 Simon Rasmussen  14 Stephan Schiffels  15 Sankar Subramanian  4 Joanne L Wright  4 Anders Albrechtsen  16 Chiara Barbieri  12   17 Isabelle Dupanloup  2   3 Anders Eriksson  18   19 Ashot Margaryan  1 Ida Moltke  16 Irina Pugach  12 Thorfinn S Korneliussen  1 Ivan P Levkivskyi  20 J Víctor Moreno-Mayar  1 Shengyu Ni  12 Fernando Racimo  10 Martin Sikora  1 Yali Xue  8 Farhang A Aghakhanian  21 Nicolas Brucato  22 Søren Brunak  23 Paula F Campos  1   24 Warren Clark  25 Sturla Ellingvåg  26 Gudjugudju Fourmile  27 Pascale Gerbault  28   29 Darren Injie  30 George Koki  31 Matthew Leavesley  32 Betty Logan  33 Aubrey Lynch  34 Elizabeth A Matisoo-Smith  35 Peter J McAllister  36 Alexander J Mentzer  37 Mait Metspalu  38 Andrea B Migliano  29 Les Murgha  39 Maude E Phipps  21 William Pomat  31 Doc Reynolds  40 Francois-Xavier Ricaut  22 Peter Siba  31 Mark G Thomas  28 Thomas Wales  41 Colleen Ma'run Wall  42 Stephen J Oppenheimer  43 Chris Tyler-Smith  8 Richard Durbin  8 Joe Dortch  44 Andrea Manica  18 Mikkel H Schierup  9 Robert A Foley  1   45 Marta Mirazón Lahr  1   45 Claire Bowern  46 Jeffrey D Wall  47 Thomas Mailund  9 Mark Stoneking  12 Rasmus Nielsen  1   48 Manjinder S Sandhu  8 Laurent Excoffier  2   3 David M Lambert  4 Eske Willerslev  1   8   18
Affiliations

A genomic history of Aboriginal Australia

Anna-Sapfo Malaspinas et al. Nature. .

Abstract

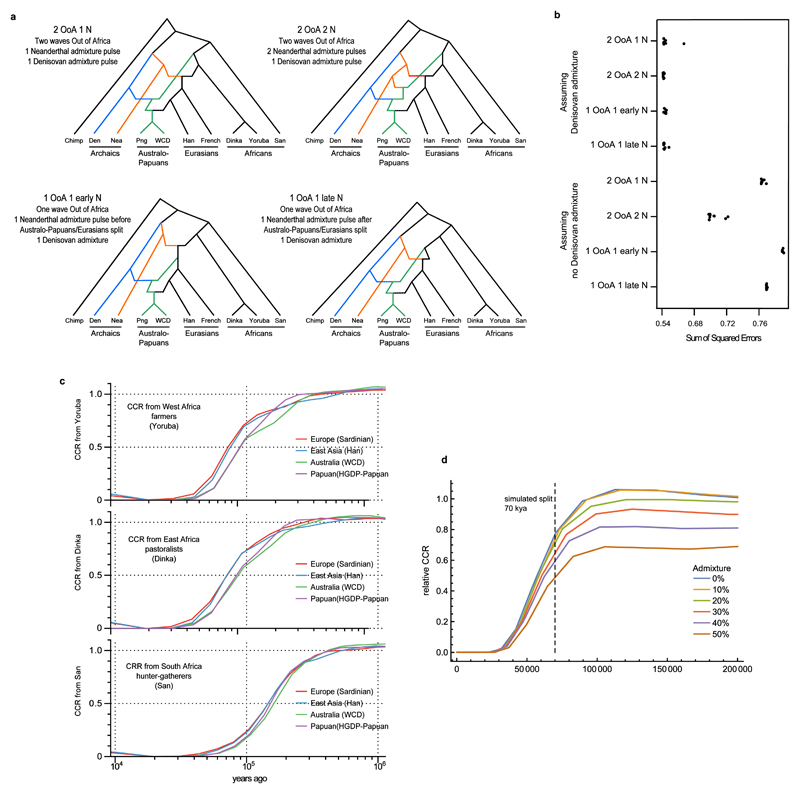
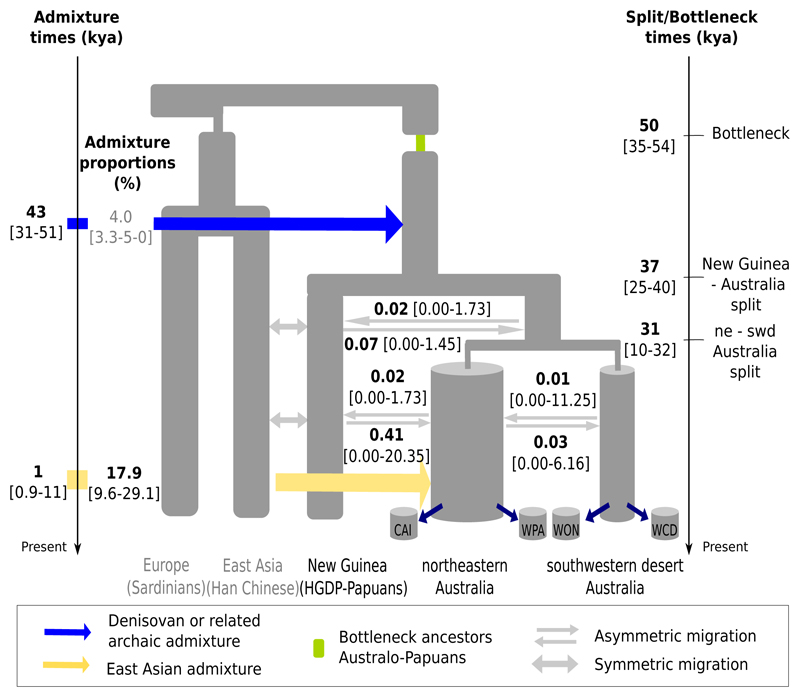
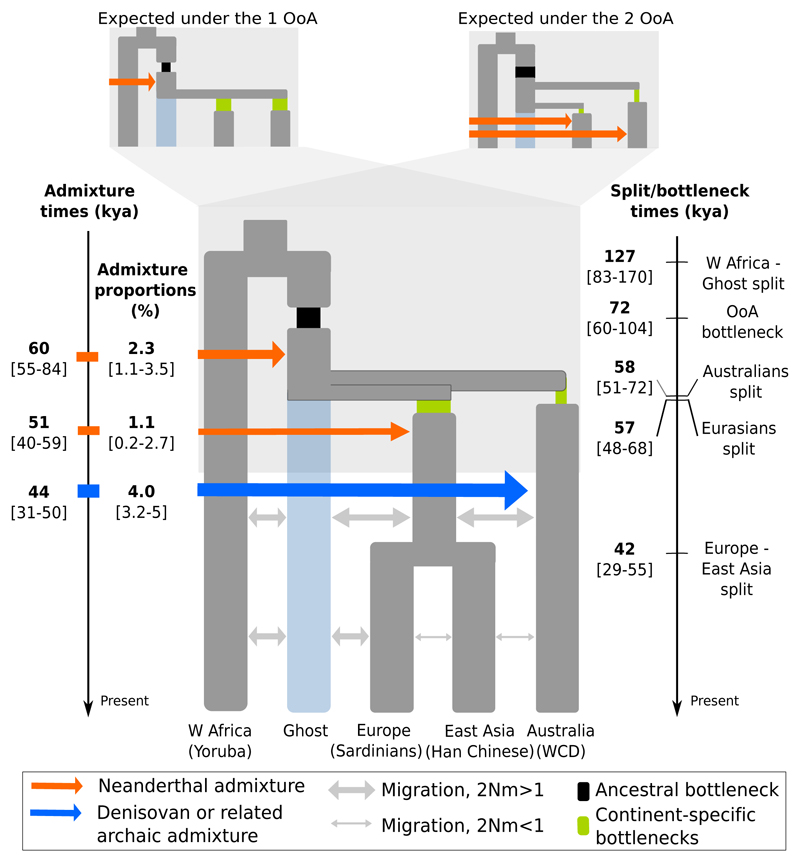
The population history of Aboriginal Australians remains largely uncharacterized. Here we generate high-coverage genomes for 83 Aboriginal Australians (speakers of Pama-Nyungan languages) and 25 Papuans from the New Guinea Highlands. We find that Papuan and Aboriginal Australian ancestors diversified 25-40 thousand years ago (kya), suggesting pre-Holocene population structure in the ancient continent of Sahul (Australia, New Guinea and Tasmania). However, all of the studied Aboriginal Australians descend from a single founding population that differentiated ~10-32 kya. We infer a population expansion in northeast Australia during the Holocene epoch (past 10,000 years) associated with limited gene flow from this region to the rest of Australia, consistent with the spread of the Pama-Nyungan languages. We estimate that Aboriginal Australians and Papuans diverged from Eurasians 51-72 kya, following a single out-of-Africa dispersal, and subsequently admixed with archaic populations. Finally, we report evidence of selection in Aboriginal Australians potentially associated with living in the desert.


Figures

Extended Data Figure 1
Extended Data Figure 1. Per individual admixture proportions of K=7 ancestral components including Aboriginal Australians, New Guineans, Europeans, Africans, Melanesians and Polynesians.
The genome of each individual is depicted as a bar and is coloured according to the estimated genome-wide proportions of ancestry components. An unrooted tree showing the relationships between the identified ancestral components is also estimated by our method. Each ancestry has been labelled with the name of the population (see also map) showing the highest fraction of that ancestral component. The cross validation (CV) error is minimised for this value of K for 5-fold CV (S05). The rooted tree supports the shared genetic origin of Aboriginal Australians, Papuans and Bougainvilleans.
Extended Data Figure 2
Extended Data Figure 2. Genetic relationships of Aboriginal Australians and Papuans.
a, Genetic affinities between a Western Central Desert (WCD02) genome and Aboriginal Australians and Papuans. Outgroup f3 statistics between WCD02 and all other Aboriginal Australians and Highland Papuan individuals that were whole-genome sequenced for this study, using all genotypes called from the sequencing data. Because the widespread recent admixture in Aboriginal Australians has large confounding effects on the f3 statistics, the values were adjusted using the slope coefficient from a simple linear regression model fitted to the relationship between f3 and the fraction of non-indigenous (i.e., not Aboriginal Australian nor Papuan) ancestry in each individual genome. The adjusted f3 statistics display a genetic gradient that separates western and eastern Aboriginal Australian populations. However, we find no differences between Papuan population samples in their level of Aboriginal Australian affinity (Kruskal-Wallis test, p-value = 0.083). Horizontal lines correspond to ±1 standard error. b, Genetic affinities between a Papuan highlander genome and Aboriginal Australians and Papuans. The Papuan highlander sample MAR01 from the Marawaka area was arbitrarily chosen as a reference point for this analysis. f3 values were adjusted for recent admixture as in (a). All Aboriginal Australian groups display a similar level of Highland Papuan affinity (with the exception of three outlier individuals from the north-eastern WPA and CAI populations: WPA06, WPA05 and CAI10, the latter two of which are known to have at least one parent with origins in Papua New Guinea or the Torres Strait Islands). While some differences between groups are actually statistically significant (Kruskal-Wallis test, p-value = 0.0002, after removing the three outliers), which could be consistent with e.g. low levels of Papuan gene flow into some Aboriginal Australian groups (see S06 and S07), we caution that some of these differences are likely due to imperfect adjustment for Eurasian admixture (the adjusted f3 is highest in the WCD population, which has the least Eurasian admixture). Horizontal lines correspond to ±1 standard error. c, MSMC analyses. Linear interpolation through the midpoints of the time intervals of the relative cross coalescence rate estimates from MSMC using pairs of individuals including one HGDP-Papuan and one other individual as indicated. We used CAI01, PIL06, WCD01, WON03 and an ECCAC sample for this analysis (see S08 for details). The MSMC results were scaled using a mutation rate of 1.25x10⁻⁸ /generation/site as suggested in and a generation time of 29 years corresponding to the average hunter-gatherer generation interval for males and females.
Extended Data Figure 3
Extended Data Figure 3. Introgressed archaic sites and putative Denisovan and Neanderthal haplotypes.
a, Distribution of per individual number of putative introgressed sites from archaic humans. The number of Neanderthal-specific introgressed sites increases from Europe to Australia, and then decreases in Amerindians, which is consistent with recurrent Neanderthal (or Neanderthal-related archaic) gene flow during the expansion into Eurasia. Our results are thus indicative of several pulses of Neanderthal gene flow into modern humans, as inferred previously. We note, however, that the apparent high levels in Neanderthal-specific introgressed sites in Australo-Papuans can be explained by the expected number of misclassified Neanderthal introgressed sites resulting from the shared ancestry with Denisovans (see S10 for details). b, c, d, e, Putative Denisovan (PDH) and Neanderthal haplotypes (PNH). The putative haplotypes correspond to clusters (four or more SNPs spanning at least 4kb) of heterozygous or homozygous genotypes in complete linkage disequilibrium (“diplotypes”) that are potentially the result of Neanderthal or Denisovan admixture. Those diplotypes are homozygous ancestral in 10 Africans, homozygous derived in the Denisovan for the PDH (respectively Neanderthal for the PNH), homozygous ancestral in the Neanderthal for the PDH (respectively Denisovan for the PNH), and with the derived allele segregating in all other contemporary non-African humans (see S11 for details). We report the average number of the PDHs and PNHs (b), the correlation between the estimated amount of Australo-Papuan ancestry (see Figure 2b, Extended Data Figure 1, S05) and the number of identified PDHs for each Australian sample, the sum of the lengths (d) and the average length (d) of the PDHs and PNHs per individual for worldwide populations included in our reference panel (see S03).
Extended Data Figure 4
Extended Data Figure 4. Out of Africa: admixture graphs based on D-statistic and MSMC analyses.
a, Admixture graphs representing some of the topologies considered for the two waves and one wave Out of Africa models assuming Denisovan admixture. All topologies are identical except for the coloured lineages representing Australo-Papuans (green), Neanderthal (Nea, orange) and Denisovan (Den, blue). The graphs differ in (i) the number of OoA events, and (ii) the number of Neanderthal admixture pulses. Png stands for HGDP-Papuan. b, Sum of Squared Errors between the observed D-statistics and the expectations for each quartet in the graph involving the chimpanzee as an outgroup for each of the admixture graphs shown in a and the corresponding four without Denisovan admixture. Each point is the result of the optimization procedure with different starting points. See S09 for details. c, MSMC analyses. Relative cross coalescence rate (CCR) estimates from MSMC for pairs of individuals including one African sample (Yoruba, Dinka and San) and one other sample from Eurasia, as indicated in the legend. d, Simulation study to assess the effect of archaic admixture on the CCR rates. Relative CCR estimated for data simulated under a simple two population divergence model where one of the populations admixed at different rates with an archaic population. See S08 for details.
Extended Data Figure 5
Extended Data Figure 5. Inferred deleterious mutations.
a, Boxplot of the number of derived homozygous sites per individual for worldwide populations that are predicted to be deleterious. Deleteriousness of SNPs was inferred using GERP Rejected Substitution (RS) scores. Derived alleles with a RS score larger than 2 were considered to be deleterious, see S11. Average RS score per individual calculated across heterozygous sites (b), and derived homozygous sites (c). Each coloured symbol corresponds to estimates from a single individual. Homozygosity is calculated as the number of derived homozygous sites divided by the number of sites at which an individual carries at least one copy of the derived allele. Solid lines show the linear regression of homozygosity against average RS score per individual for non-African modern humans. Dashed lines indicate the 95% confidence interval for the linear regression.
Extended Data Figure 6
Extended Data Figure 6. Effective population size changes over time.
a, MSMC analyses. Population size estimates from MSMC for pairs of individuals from several populations within and outside of Australia. For each run, we used two individuals from each population, i.e., four haplotypes in each run. MSMC results were scaled as in Figure 3. b, Bayesian Skyline Plots. Bayesian Skyline Plots (BSP) calculated from the mtDNA genome sequences, showing the effective population size estimates over time when considering either groups from northeastern Australia (CAI, WPA) or groups from southwestern Australia (ENY, NGA, WCD, WON). Solid lines are the estimates, dashed lines are the corresponding 95% credible intervals (see S12).
Extended Data Figure 7
Extended Data Figure 7. Genetics mirrors geography and languages.
a, b. Procrustes analyses of the first two dimensions of a classical multidimensional scaling (MDS) analysis of the Aboriginal Australian genome sequences (autosomes). We considered two cases: an analysis including all variants (a), or only the variants remaining after genomic regions of putative recent European and East Asian (i.e., Han Chinese) origin are “masked” (b, S06). Both MDS plots have been rotated towards the best overlap with geographic sampling locations as defined by Procrustes analysis. In each plot, the arrows indicate the error of the MDS coordinates towards the assigned population sampling geographic coordinates. We find that the genetic relationships within Australia mirrors geography, with a significant correlation for both cases, i.e. rGEN,GEO = 0.59, p-value < 0.0005 for all variants and even higher (rGEN,GEO = 0.77, p-value < 0.0005) for the masked data. We find using the Bearing correlogram approach that the main axis of genetic differentiation in the masked Aboriginal Australian genomes is at angle = 65° compared to the equator, i.e., in the southwest to northeast direction (S13). c,d. Correspondence between genetics and linguistics. Unrooted Neighbor-Joining FST-based genetic tree (cladogram). Weir and Cockerham FST distance was computed between the Aboriginal Australian populations after masking the Eurasian tracts. Statistical robustness of each branch was estimated by means of a bootstrap analysis (1000 replicates, S05). d, Bayesian phylogenetic tree for the 28 different Pama-Nyungan languages represented in this sample (from, see S15). Posterior probabilities are also indicated. Note that one language group can be shared by different Aboriginal Australian groups. The linguistic tree was built with BEAST (50). e,f,g. Gene flow across the continent. e, Mantel non-parametric r (estimating the goodness of fit between genetic differentiation and connectivity) versus ratios of resistance of inland to coastal nodes, showing a peak at 1.7. f, Best fit of pairwise population genetic differentiation, FST (computed between the nine Aboriginal Australian groups after masking Eurasian tracts (S06)), versus pairwise connectivity based on the environment (estimated as resistance) when moving inland is 1.7 times harder than moving along coastal nodes. g, Gene flow across the Australian landscape, quantified as the cumulative current for pairwise connections among Aboriginal Australian groups (black circles), with larger current (warmer colours) representing greater gene flow.
Extended Data Figure 8
Extended Data Figure 8. European, East Asian and Papuan genomic tracts in Aboriginal Australians.
a, Distribution of the tracts assigned to Aboriginal Australian (WCD), Papuan, East Asian or European ancestry for 58 unrelated non-WCD Australian samples. Most of the shorter tracts were of Papuan origin, suggesting that a large fraction of the Papuan gene flow is much older than that from Europe and East Asia, consistent with a Papuan influence spreading slowly from northeastern to southwestern Australia by ancient migration. b, Corresponding scatter plot with fitted line of per-individual variance in Papuan tract length vs. geographic distance from WCD, the latter calculated using the Great Circle Distance formula for pairs of individual GPS coordinates. Papuan tract distribution showed a strong and significant correlation with distance from WCD (r = 0.64; p-value < 10-5), with “younger tracts” closer to New Guinea (i.e., with a larger variance) and “older tracts” closer to WCD” (i.e., with a smaller variance). This is also consistent with continuous Papuan gene flow spreading from the northeast.
Figure 1
Figure 1. Aboriginal Australian and Papuan samples used in this study, as well as archaeological sites and human remains dated to ~40 kya or older in southern Sunda and Sahul.
The stars indicate the centroid location for each sampling group (sample size in parentheses). Publicly available genetic data (see S04) used as a reference panel in this study are shown as squares. Sites with dated human remains are shown as white circles and the archaeological sites as black circles. The associated dates can be found in S03. Grey boundaries correspond to territories defined by the language groups provided by the Australian Institute of Aboriginal and Torres Strait Islander Studies. Sampled Aboriginal Australians self-identify primarily as: Yidindji and Gungandji from the Cairns region (CAI, 10, see also S02); Yupangati and Thanakwithi from northwest Cape York (WPA, 6), Wangkangurru and Yarluyandi from the Birdsville region (BDV, 10, 9 sequenced at high depth), Barkindji from southeast (RIV, 8); Pilbara area Yinhawangka and Banjima (PIL, 12), Ngaanyatjarra from western central desert (WCD, 13), Wongatha from WA’s northern Goldfields (WON, 11), Ngadju from WA’s southern Goldfields (NGA, 6); and Nyungar from southwest Australia (ENY, 8). Papuans include samples from the locations Bundi (BUN, 5), Kundiawa (KUN, 5), Mendi (MEN, 5), Marawaka (MAR, 5) and Tari (TAR, 5). We generated SNP array data (black stars) for 45 Papuan samples including 24 Koinambe (KOI) and 15 Kosipe (KOS) - described before - and 6 individuals with Highland ancestry sampled in Port Moresby (PMO). Lake Carpentaria (LC), which covered a significant portion of the land bridge between Australia and New Guinea 11.5-40 kya and thus potentially acted as a barrier to gene flow, is also indicated. Map data were sourced from the Australian Government, http://www.naturalearthdata.com/ and our research.
Figure 2
Figure 2. Genetic ancestry of Aboriginal Australians in a worldwide context.
a, Classical Multidimensional scaling (MDS) plot of first two dimensions based on an identity-by-state (IBS) distance matrix (based on 54,971 SNPs) between individuals from this study and worldwide populations, including publicly available data,,,. The first two dimensions explain 19% of the variance in the IBS distance matrix. Individuals are colour-coded according to sampling location, grouped into Australia (Arnhem Land, ECCAC, BDV, CAI, ENY, NGA, PIL, RIV, WCD, WON, WPA); East Asia (Cambodian, Dai, Han, Japanese, Naxi); Europe (English, French, Sardinian, Scottish, Spanish); India (Vishwabrahmin, Dravidian, Punjabi, Guaharati); and New Guinea (HGDP Papuan, Central Province, Eastern Highlands, Gulf Province, Highlands, PMO, KOI, KOS, BUN, KUN, MEN, TAR, MAR). Stars indicate the centroid for each Aboriginal Australian group. Aboriginal Australians from this study as well as from previous studies are closest to Papuans and also show signals of admixture with Eurasians (see S05 for details). b, Estimation of genomic ancestry proportions for the best number of ancestral components (K=7) based on Aboriginal Australian and Papuan whole genome sequence and SNP array data from this study (see Figure 1), and publicly available SNP array data,,, (S05). Each ancestry component has been labelled according to the geographic region showing the corresponding highest frequency. The area of each pie chart is proportional to the sample size (as depicted in the legend). The genomes of Aboriginal Australian populations are mostly a mixture of European and Aboriginal Australian ancestry components. Northern Aboriginal Australian groups (Arnhem Land, CAI, ECCAC, PIL and WPA) are also assigned to components mainly present in East Asian populations, while northeastern Aboriginal Australian groups (CAI and WPA) also show components mainly present in New Guinean populations. A background of 5% “Melanesian” component is observed in all the Aboriginal Australian populations; however, this component is widely spread over the geographic area shown in this figure, being present from Taiwan to India. We detected on average 1.5% “Indian” component and 1.4% “Polynesian” component across the Aboriginal Australian samples, but we attribute these residual ancestry components to statistical noise as they are present in other southeast Asian populations and are not supported by other analyses (S05). c, A heat map displaying outgroup f3 statistics of the form f3(Mbuti; WCD02, X), quantifying genetic drift shared between the putatively unadmixed individual WCD02 chosen to represent the Aboriginal Autralian population, and various populations throughout the broader region for which either array genotypes or whole-genome sequencing data were publicly available or generated in this study. We used 760,116 SNPs for which WCD02 had non-missing array genotypes that overlapped with any other datasets. Standard errors as estimated from block jackknife resampling across the genome were in the range 0.00213-0.00713.
Figure 3
Figure 3. Settlement of Australia.
Best supported demographic model of the colonisation of Australia and New Guinea. The demographic history of Aboriginal Australian populations was modelled by considering that sampled individuals are from sub-populations (“islands”) that are part of two larger regions (“continents”), which geographically match the northeast (ne) and the southwestern desert (swd) regions of Australia. Maximum likelihood parameter estimates (MLEs) were obtained from the joint site frequency spectrum (SFS) of Han Chinese, HGDP-Papuans, CAI, WPA, WON and WCD. The 95% CI, obtained by non-parametric block bootstrap, are shown within square brackets. Estimated migration rates scaled by the effective population size (2Nm) are shown above/below the corresponding arrows. Only Aboriginal Australian individuals with low European ancestry were included in this analysis. In this model, we estimated parameters specific to the settlement of Australia and New Guinea (numerical values shown in black); keeping all the other demographic parameters set to the point estimates shown in Figure 4 (numerical value shown in grey here). Only admixture events involving proportions >0.5% are shown. The inferred parameters were scaled using a mutation rate of 1.25x10⁻⁸/generation/site and a generation time of 29 years corresponding to the average hunter-gatherer generation interval for males and females. See S07 for further details.
Figure 4
Figure 4. Out of Africa.
We used a likelihood-based approach to investigate whether the joint SFS supports the one-wave (1 OoA) or two-waves (2 OoA) scenarios. The maximum likelihood estimates (MLEs) are indicative of which scenario is best supported. As shown on the top left inset, under the 1 OoA scenario we expect (i) the presence of an ancestral bottleneck (in black), (ii) a relatively large Neanderthal admixture pulse shared by the ancestors of all non-Africans, and (iii) overlapping divergence times of the ancestors of Aboriginal Australians and Eurasians. In contrast, the top right inset shows parameters expected under a 2 OoA scenario: (i) a limited/absent ancestral bottleneck (in black) in the ancestors of all non-Africans, (ii) no shared Neanderthal admixture in the ancestors of all non-Africans (iii) distinct divergence times for Aboriginal Australians and Eurasians. The main population tree shows the best fitting topology, which supports the 1 OoA scenario, and maximum likelihood estimates (MLEs) for the divergence and admixture times and the admixture proportions (with 95% CI obtained by non-parametric block bootstrap shown within square brackets). We assume that the OoA event is associated with the ancestral bottleneck. The “Ghost” population represents an unsampled population related to Yoruba that is the source of the out of Africa event(s). Our results suggest that these two African populations split significantly earlier (~125 kya) than the estimated time of dispersals into Eurasia. Note that under a 1 OoA scenario, this “Ghost” population becomes, after the ancestral bottleneck, the ancestral population of all non-Africans that admixed with Neanderthals. Arrow thicknesses are proportional to the intensity of gene flow and the admixture proportions, and that only admixture events involving proportions >0.5% are displayed. The inferred parameters were scaled as for Figure 3. See S07 for further details.

Comment in

References

    1. Davidson I. The colonization of Australia and its adjacent islands and the evolution of modern cognition. Curr Anthropol. 2010;51:S177–S189.
    1. Clarkson C, et al. The archaeology, chronology and stratigraphy of Madjedbebe (Malakunanja II): A site in northern Australia with early occupation. J Hum Evol. 2015;83:46–64. - PubMed
    1. O’Connell JF, Allen J. The process, biotic impact, and global implications of the human colonization of Sahul about 47,000 years ago. J Archaeol Sci. 2015;56:73–84.
    1. Barker G, et al. The ‘human revolution’in tropical Southeast Asia: the antiquity of anatomically modern humans, and of behavioural modernity, at Niah Cave (Sarawak, Borneo) J Hum Evol. 2007;52:243–261. - PubMed
    1. Lahr MM, Foley R. Multiple dispersals and modern human origins. Evol Anthropol Issues News Rev. 1994;3:48–60.

Publication types