

doi: 10.1186/s13059-016-1050-9.
Cancer biomarker discovery is improved by accounting for variability in general levels of drug sensitivity in pre-clinical models
Affiliations
- PMID: 27654937
- PMCID: PMC5031330
- DOI: 10.1186/s13059-016-1050-9
Item in Clipboard
Cancer biomarker discovery is improved by accounting for variability in general levels of drug sensitivity in pre-clinical models
Genome Biol.
.
Abstract
We show that variability in general levels of drug sensitivity in pre-clinical cancer models confounds biomarker discovery. However, using a very large panel of cell lines, each treated with many drugs, we could estimate a general level of sensitivity to all drugs in each cell line. By conditioning on this variable, biomarkers were identified that were more likely to be effective in clinical trials than those identified using a conventional uncorrected approach. We find that differences in general levels of drug sensitivity are driven by biologically relevant processes. We developed a gene expression based method that can be used to correct for this confounder in future studies.
Figures
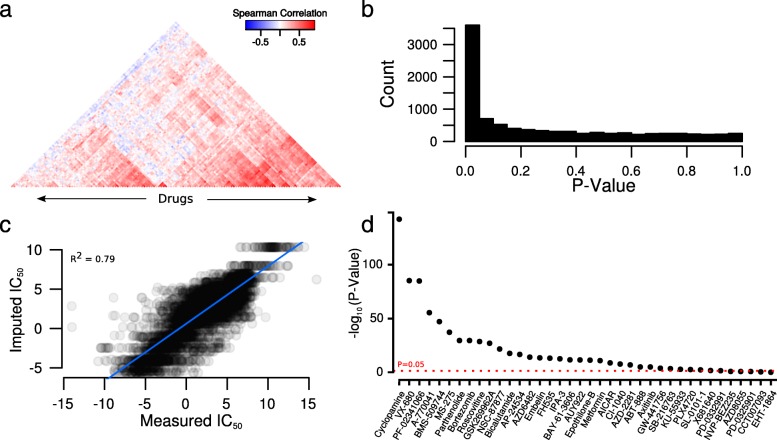
General levels of drug sensitivity can be estimated in a very large set of cell lines. a
Heatmap showing pairwise correlations between IC50 values of all drugs in CGP. Drugs are arranged (by Euclidean distance) on the x-axis. A full heatmap with visible drug names and drug class labels is provided in Additional file 2: Figure S1. b
Histogram of P values for pairwise correlation between all 138 drugs in CGP. c
Scatterplot of imputed against measured IC50 values from eight-fold cross-validation in CGP. Imputed values were estimated using our iterative matrix completion algorithm. d
P values of the Spearman correlation of the IC50 values of 38 randomly chosen drugs against the first principle component of the IC50 values of the remaining 100 drugs in CGP. Values above the dashed red line have P < 0.05
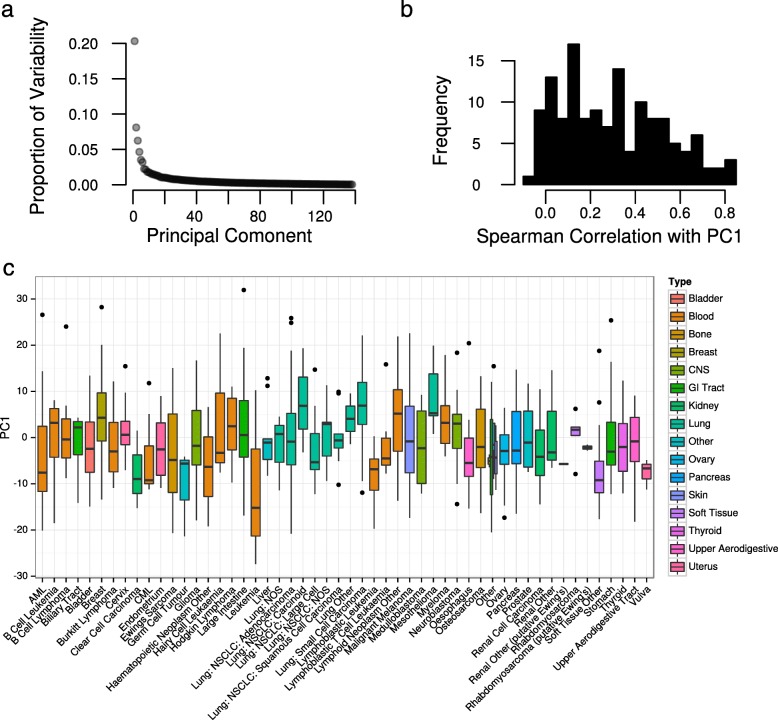
General levels of drug sensitivity in a panel of cancer cell lines. a The proportion of variability in the data explained by each of the PCs of the fully imputed drug sensitivity (IC50) data matrix in CGP. PCs are arranged by associated eigenvalue. b Histogram of Spearman correlations of the IC50 values of all 138 drugs in CGP with PC1 of the fully imputed IC50 matrix. c Boxplot of PC1 (estimated in all 714 cell lines) against tissue-of-origin in CGP. Boxes are colored by cancer type
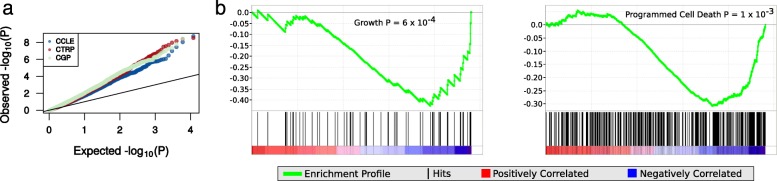
Gene expression and biological processes are associated with GLDS. a A QQ-plot where the P values for an association between gene expression and the first principle component of the completed drug sensitivity matrix are plotted against a theoretical uniform distribution. A deviation from the diagonal line in all three datasets is indicative of an enrichment of low P values. b GSEA enrichment plots for enrichment of Gene Ontology biological processes against GLDS in CGP. Data are shown for two of the most significant processes: “Growth” (left) and “Programmed Cell Death” (right)
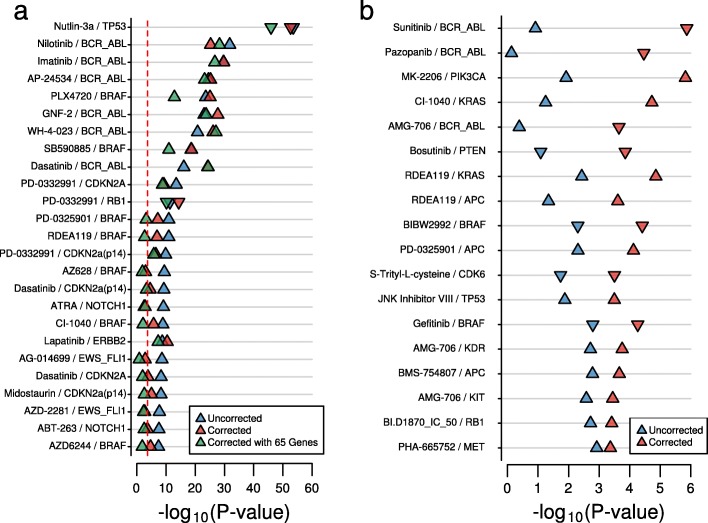
Controlling for general levels of drug sensitivity substantially affects biomarker discovery in the CGP cell lines. a
Dot-plot showing the change in P values for the top 25 associations for all sequenced cancer genes across all drugs in CGP. Results are plotted when controlling for GLDS and for an uncorrected approach. Also included are the results when controlling for GLDS estimated from expression data. The triangle is pointing in the direction of the effect (i.e. a triangle pointing up indicates a positive effect). b A similar dot-plot for the 18 novel associations identified in CGP when controlling for GLDS
References
Grants and funding
LinkOut - more resources
Full Text Sources
Other Literature Sources
