

Synchronous deficits in cumulative muscle protein synthesis and ribosomal biogenesis underlie age-related anabolic resistance to exercise in humans
- PMID: 27654940
- PMCID: PMC5157077
- DOI: 10.1113/JP272857
Synchronous deficits in cumulative muscle protein synthesis and ribosomal biogenesis underlie age-related anabolic resistance to exercise in humans
Abstract
Key points: Resistance exercise training (RET) is one of the most effective strategies for preventing declines in skeletal muscle mass and strength with age. Hypertrophic responses to RET with age are diminished compared to younger individuals. In response to 6 weeks RET, we found blunted hypertrophic responses with age are underpinned by chronic deficits in long-term muscle protein synthesis. We show this is likely to be the result of multifactorial deficits in anabolic hormones and blunted translational efficiency and capacity. These results provide great insight into age-related exercise adaptations and provide a platform on which to devise appropriate nutritional and exercise interventions on a longer term basis.
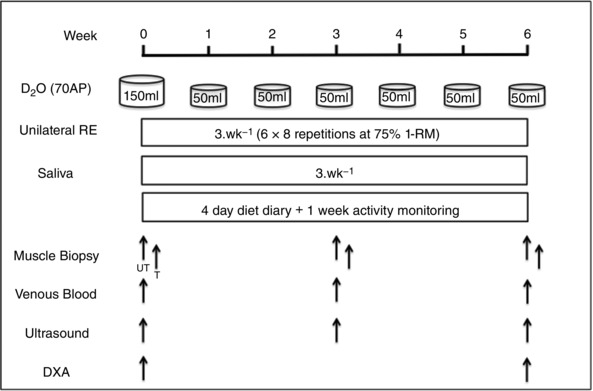
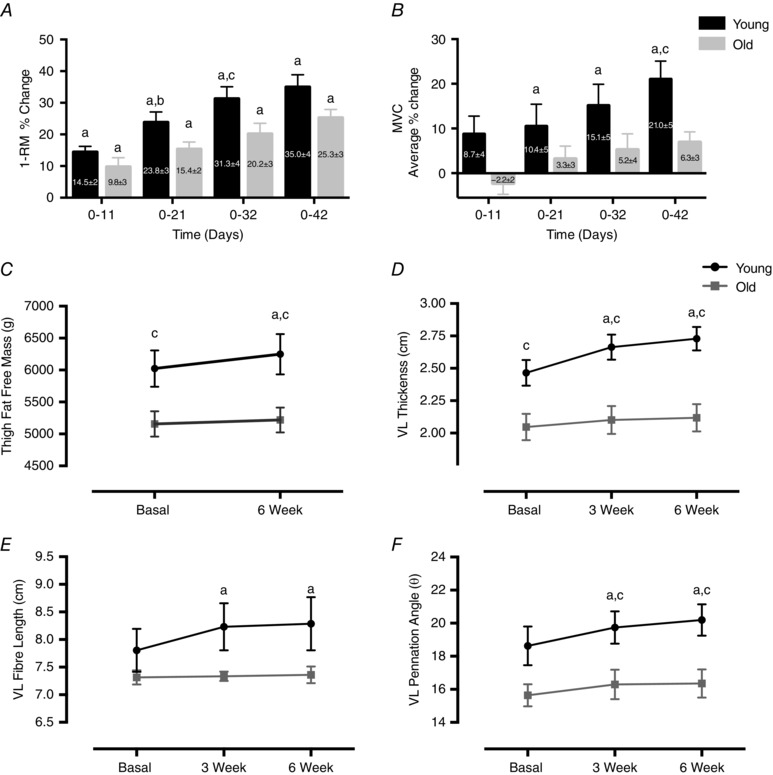
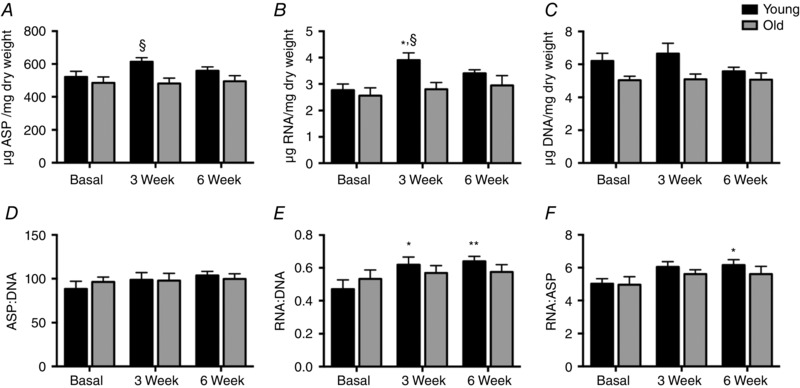
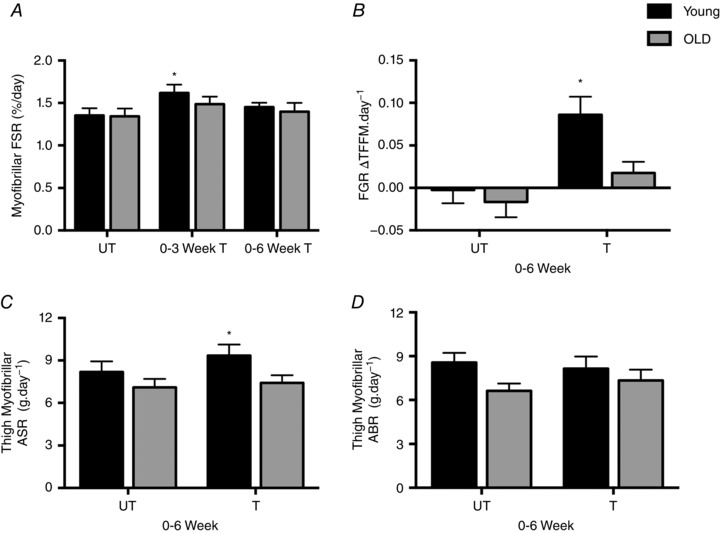
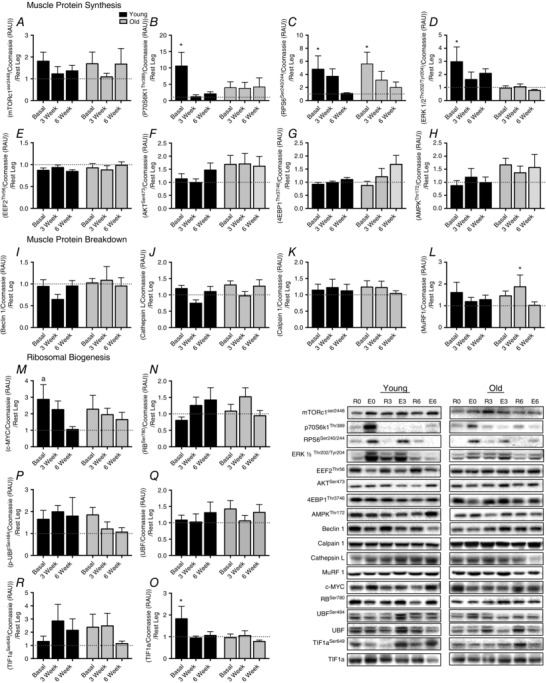
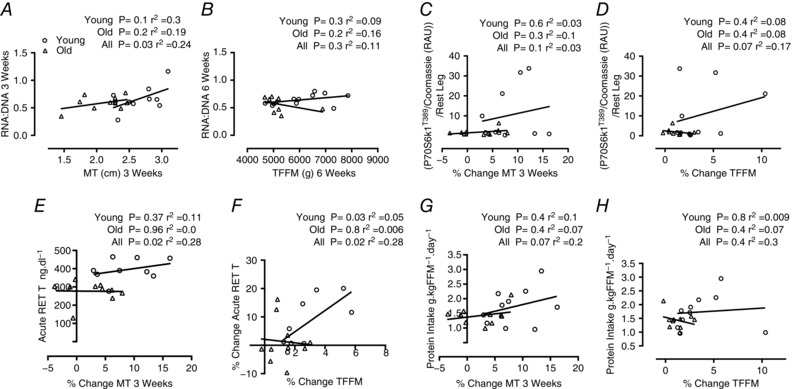
Abstract: Ageing is associated with impaired hypertrophic responses to resistance exercise training (RET). Here we investigated the aetiology of 'anabolic resistance' in older humans. Twenty healthy male individuals, 10 younger (Y; 23 ± 1 years) and 10 older (O; 69 ± 3 years), performed 6 weeks unilateral RET (6 × 8 repetitions, 75% of one repetition maximum (1-RM), 3 times per week). After baseline bilateral vastus lateralis (VL) muscle biopsies, subjects consumed 150 ml D2 O (70 atom%; thereafter 50 ml week-1 ), further bilateral VL muscle biopsies were taken at 3 and 6 weeks to quantify muscle protein synthesis (MPS) via gas chromatography-pyrolysis-isotope ratio mass spectrometry. After RET, 1-RM increased in Y (+35 ± 4%) and O (+25 ± 3%; P < 0.01), while MVC increased in Y (+21 ± 5%; P < 0.01) but not O (+6 ± 3%; not significant (NS)). In comparison to Y, O displayed blunted RET-induced increases in muscle thickness (at 3 and 6 weeks, respectively, Y: +8 ± 1% and +11 ± 2%, P < 0.01; O: +2.6 ± 1% and +3.5 ± 2%, NS). While 'basal' longer term MPS was identical between Y and O (∼1.35 ± 0.1% day-1 ), MPS increased in response to RET only in Y (3 weeks, Y: 1.61 ± 0.1% day-1 ; O: 1.49 ± 0.1% day-1 ). Consistent with this, O exhibited inferior ribosomal biogenesis (RNA:DNA ratio and c-MYC induction: Y: +4 ± 2 fold change; O: +1.9 ± 1 fold change), translational efficiency (S6K1 phosphorylation, Y: +10 ± 4 fold change; O: +4 ± 2 fold change) and anabolic hormone milieu (testosterone, Y: 367 ± 19; O: 274 ± 19 ng dl-1 (all P < 0.05). Anabolic resistance is thus multifactorial.
Keywords: ageing; exercise; hypertrophy; muscle; protein synthesis; ribosomal biogenesis; signalling; stable isotope.
© 2016 The Authors. The Journal of Physiology published by John Wiley & Sons Ltd on behalf of The Physiological Society.
Figures
Comment in
-
Impaired ribosome biogenesis could contribute to anabolic resistance to strength exercise in the elderly.J Physiol. 2017 Mar 1;595(5):1447-1448. doi: 10.1113/JP273773. Epub 2017 Jan 19. J Physiol. 2017. PMID: 28105708 Free PMC article. No abstract available.
-
Less is more: the role of mTORC1 activation in the progression of ageing-mediated anabolic resistance.J Physiol. 2017 May 1;595(9):2781-2782. doi: 10.1113/JP274154. J Physiol. 2017. PMID: 28233314 Free PMC article. No abstract available.
References
-
- Atherton PJ, Etheridge T, Watt PW, Wilkinson D, Selby A, Rankin D, Smith K & Rennie MJ (2010). Muscle full effect after oral protein: Time‐dependent concordance and discordance between human muscle protein synthesis and mTORC1 signaling. Am J Clin Nutr 92, 1080–1088. - PubMed
-
- Atherton PJ, Miller BF, Burd NA, et al (2015). Commentaries on Viewpoint: What is the relationship between acute measure of muscle protein synthesis and changes in muscle mass? J Appl Physiol 118, 498–503.
-
- Baar K & Esser K (1999). Phosphorylation of p70(S6k) correlates with increased skeletal muscle mass following resistance exercise.Am J Physiol Cell Physiol 276, C120–C127. - PubMed
Publication types
MeSH terms
Substances
Grants and funding
LinkOut - more resources
Full Text Sources
Other Literature Sources
Medical
Miscellaneous