. 2016 Sep 21;13(1):249.
doi: 10.1186/s12974-016-0722-4.

Interferon-γ blocks signalling through PDGFRβ in human brain pericytes

Affiliations

Interferon-γ blocks signalling through PDGFRβ in human brain pericytes

Deidre Jansson et al. J Neuroinflammation. .

Abstract

Background: Neuroinflammation and blood-brain barrier (BBB) disruption are common features of many brain disorders, including Alzheimer's disease, epilepsy, and motor neuron disease. Inflammation is thought to be a driver of BBB breakdown, but the underlying mechanisms for this are unclear. Brain pericytes are critical cells for maintaining the BBB and are immunologically active. We sought to test the hypothesis that inflammation regulates the BBB by altering pericyte biology.

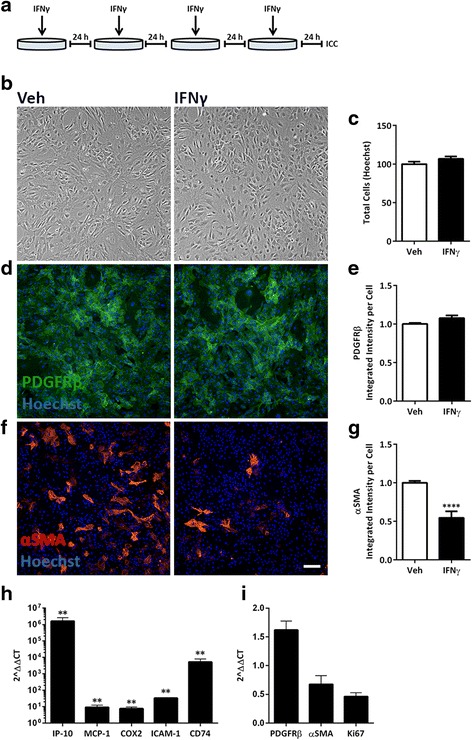
Methods: We exposed primary adult human brain pericytes to chronic interferon-gamma (IFNγ) for 4 days and measured associated functional aspects of pericyte biology. Specifically, we examined the influence of inflammation on platelet-derived growth factor receptor-beta (PDGFRβ) expression and signalling, as well as pericyte proliferation and migration by qRT-PCR, immunocytochemistry, flow cytometry, and western blotting.

Results: Chronic IFNγ treatment had marked effects on pericyte biology most notably through the PDGFRβ, by enhancing agonist (PDGF-BB)-induced receptor phosphorylation, internalization, and subsequent degradation. Functionally, chronic IFNγ prevented PDGF-BB-mediated pericyte proliferation and migration.

Conclusions: Because PDGFRβ is critical for pericyte function and its removal leads to BBB leakage, our results pinpoint a mechanism linking chronic brain inflammation to BBB dysfunction.

Keywords: Blood-brain barrier; Inflammation; Migration; Proliferation.


Figures

Fig. 1
Fig. 1
Chronic IFNγ treatment alters αSMA, but not PDGFRβ expression, or cell number in human brain pericytes. a Pericytes were treated for four consecutive days (once every 24 h) with either vehicle (Veh) or IFNγ (1 ng/mL) as depicted. b, c Cells were then fixed and imaged under brightfield (b), and total cells counted from Hoechst labelled nuclei (c). dg Representative images and quantification of PDGFRβ (green) (d, e), or αSMA (red) (f, g) overlaid with Hoechst. Scale bar, 100 μm. The integrated intensity of the staining was normalized to cell number (Hoechst) (c) and vehicle conditions, quantified from triplicate wells, and plotted as mean ± s.e.m. (n = 3) and ****(p < 0.0001) (Student’s t test). h, i mRNA from pericytes treated as in a was analysed by qRT-PCR. Inflammatory target gene (IP-10, MCP-1, COX2, ICAM-1, CD74) (h) and pericyte marker and proliferation marker gene (PDGFRβ, αSMA and Ki67) (i) expression was normalized to GAPDH and plotted as a mean fold change from vehicle (set to 1) (2^ΔΔCT) ± s.e.m. (n = 3), **(p < 0.01) by a Mann-Whitney, non-parametric test of ΔCT values
Fig. 2
Fig. 2
Human brain pericytes respond to PDGF-BB signals in vitro. a Pericytes were serum starved for 2 h, then treated with vehicle (lanes 1 and 7) or PDGF-BB (100 ng/mL) (lanes 2–6, and 8) for the indicated times, and analysed by SDS-PAGE. Representative blots from three cases are shown. b Blots from a were analysed and quantified with Image Studio™. Phosphorylated PDGFRβ (Tyr751) (p-PDGFRβ) (b), PDGFRβ (c), and PDGF-BB (f) were normalized to GAPDH; phosphorylated Akt (Ser473) (p-Akt) (d) and phosphorylated ERK (Tyr204) (p-ERK) (e) were normalized to total Akt and ERK, respectively. **Bottom band in pERK blot is GAPDH
Fig. 3
Fig. 3
Chronic IFNγ treatment increases PDGFRβ phosphorylation and internalization. a Pericytes were treated for four consecutive days (once every 24 h) with either vehicle (Veh) or IFNγ (1 ng/mL). After 96 h total treatment, cells were serum starved for 2 h and then treated with vehicle (−) or PDGF-BB (100 ng/mL) for 30 min as depicted. b Representative western blots of treated pericytes (n = 3). ce Bands were quantified with Image Studio™ and normalized to vehicle control. p-PDGFRβ (c) was normalized to total PDGFRβ, and p-Akt (d) and p-ERK (e) were normalized to total Akt and ERK, respectively. f Representative images of pericytes treated as in a showing PDGFRβ (green) and Hoechst (blue), scale bar, 10 μm. g PDGFRβ puncta in f were quantified using MetaXpress™ software and normalized to cell number and vehicle control and plotted as mean ± s.e.m. (n = 3), ****(p < 0.0001), ###(p < 0.001), *(p < 0.05) (two-way ANOVA). h Cellular localization of PDGFRβ (green) and nuclei (blue) in pericytes treated with vehicle (Veh) or PDGF-BB (100 ng/mL) for 30 min as above using confocal microscopy. Scale bar, 5 μm
Fig. 4
Fig. 4
Chronic IFNγ increases PDGFRβ membrane expression. a, b Detection of PDGF-BB in pericyte conditioned media. Human brain pericytes at 90 % confluence were left untreated (control (Con)) or serum starved for 2 h and then treated with vehicle, IFNγ (1 ng/mL), PDGF-BB (100 ng/mL), or both IFNγ and PDGF-BB for 24 h. Lysates were collected for western blot analysis with the indicated antibodies, and a representative blot is shown (n = 2) (a) Bands were quantified with Image Studio™ software and intensity was normalized to vehicle control (b); PDGF-BB was normalized to GAPDH. ce Pericytes were treated for 0, 24, 48, 72, or 96 h (more cytokines added once every 24 h to appropriate wells) with vehicle (Veh) or IFNγ (1 ng/mL). c Grey value intensities of PDGFRβ membrane staining are depicted in a pseudo-colour image according to the legend (right). d Representative images of membrane PDGFRβ (red) and Hoechst (blue) in pericytes after 96 h of vehicle or IFNγ treatment. Scale bar, 100 μm. e Quantification of total PDGFRβ (white bars) and membrane PDGFRβ (black bars) staining intensity per cell was normalized to 0 h time point, plotted as mean ± s.e.m. (n = 3), ****(p < 0.0001), ***(p < 0.001), **(p < 0.01) (ANOVA). f, g Pericytes were treated for four consecutive days (once every 24 h) with either vehicle (Veh) or IFNγ (1 ng/mL). After 96 h total treatment, cells were serum starved for 2 h and then treated with vehicle (Veh) or PDGF-BB (100 ng/mL) for 30 min. Surface PDGFRβ expression was analysed using flow cytometry, and a representative plot is shown (f). Mean fluorescence intensity (MFI) of cell surface PDGFRβ is plotted as mean ± s.e.m. (n = 3) (g)
Fig. 5
Fig. 5
Chronic IFNγ treatment and PDGFRβ knockdown blocks PDGF-BB-induced proliferation in pericytes. a Pericytes were treated for four consecutive days (once every 24 h) with either vehicle (Veh) or IFNγ (1 ng/mL). b, c After 48 h of cytokine treatment, cells were treated with either vehicle or PDGF-BB (10 ng/mL) to measure the PDGF-induced proliferative response. This was done in two ways: after 96 h total treatment, cells were fixed, labelled with a Ki67 antibody and Hoechst (b); alternatively, EdU was added to measure cell proliferation over the final 24 h of the experiment (c). Positive cells of the total cells measured by Hoechst (d) were quantified and plotted as mean ± s.e.m. (n = 3), ****, ####(p < 0.0001), ***(p < 0.001), *(p < 0.05) from a two-way ANOVA. e, f LDH release (e) and AlamarBlue reduction (f) were also measured as cell death and cell health outputs, respectively, from the above proliferation experiments. g Knockdown of PDGFRβ in pericytes with siRNA after 96 h immunolabelled for PDGFRβ (green) and Hoechst (blue), scale bar, 100 μm. h, i Quantification of pericytes positive for PDGFRβ after siRNA knockdown. Percent positive for PDGFRβ (h) of the total cells measured by Hoechst (i), mean (per well) ± s.e.m. (n = 1). j Representative western blot of PDGF-BB response in PDGFRβ deficient pericytes (n = 2). km Proliferation response to PDGF-BB in PDGFRβ deficient pericytes after 48 h. Ki67 (k), EdU (l) positive, and total cells (m) mean ± s.e.m. (n = 5) were plotted and analysed with two-way ANOVA, ****(p < 0.0001), ###(p < 0.001), ***(p < 0.001), and *(p < 0.05)
Fig. 6
Fig. 6
IFNγ blocks pericyte migration independently of PDGF-BB. a, b Cell migration was measured by scratching wells after 48 h of IFNγ (1 ng/mL) treatment and measuring the number of cells that moved into the gap area after a further 48 h with vehicle or PDGF-BB (10 ng/mL) treatment. Representative images of Coomassie-stained pericytes are presented in a, and manual counts of cells in the gap area (normalized to vehicle-treated condition), plotted as mean ± s.e.m. (n = 3) ####, ****(p < 0.0001), **(p < 0.01), (two-way ANOVA), are presented in b Scale, 500 μm. c Magnified view of pericytes from migrating edge of scratch wound from conditions in a Scale bar, 100 μm
Fig. 7
Fig. 7
Chronic IFNγ treatment reduces PDGFRβ re-synthesis following ligand-stimulated degradation. ac Pericytes were treated for four consecutive days (once every 24 h) with either vehicle (Veh) or IFNγ (1 ng/mL); the final 48 h was in the presence of either vehicle or PDGF-BB (10 ng/mL), with representative images of PDGFRβ (green), αSMA (red), and Hoechst (blue) (a) Scale bar, 100 μm. Quantification of PDGFRβ (b) and αSMA (c) staining, mean ± s.e.m. (n = 3), ####, ****(p < 0.0001), ***(p < 0.001), **(p < 0.01) (two-way ANOVA). df Pericytes were treated for three or four consecutive days (once every 24 h) with either vehicle (Veh) or IFNγ (1 ng/mL). After 48 h, cells were treated with PDGF-BB (10 ng/mL) for either 24 or 48 h. Representative blots of PDGFRβ, αSMA, and GAPDH (d) Quantification of band intensity of PDGFRβ (e) and αSMA (f), both normalized to GAPDH, mean ± s.e.m. (n = 3), **(p < 0.01), *(p < 0.05) (two-way ANOVA). gi Pericytes were pre-treated for 48 h (once every 24 h) with either vehicle or IFNγ (1 ng/mL) and then treated with PDGF-BB (10 ng/mL) for 24, 48, 72, or 96 h (with IFNγ being added every 24 h throughout). qRT-PCR analysis of PDGFRβ (g), αSMA (h), and Ki67 (i) transcripts was normalized to vehicle treatment and plotted as mean ± s.e.m. (n = 3), ####, ****(p < 0.0001), ##, **(p < 0.01), *(p < 0.05) (two-way ANOVA)

References

    1. Erickson MA, Dohi K, Banks WA. Neuroinflammation: a common pathway in CNS diseases as mediated at the blood-brain barrier. Neuroimmunomodulation. 2012;19(2):121–30. doi: 10.1159/000330247. - DOI - PMC - PubMed
    1. Zhao Z, Nelson AR, Betsholtz C, Zlokovic BV. Establishment and dysfunction of the blood-brain barrier. Cell. 2015;163(5):1064–78. doi: 10.1016/j.cell.2015.10.067. - DOI - PMC - PubMed
    1. Obermeier B, Daneman R, Ransohoff RM. Development, maintenance and disruption of the blood-brain barrier. Nat Med. 2013;19(12):1584–96. doi: 10.1038/nm.3407. - DOI - PMC - PubMed
    1. Giunta B, Obregon D, Velisetty R, Sanberg PR, Borlongan CV, Tan J. The immunology of traumatic brain injury: a prime target for Alzheimer’s disease prevention. J Neuroinflammation. 2012;9:185. doi: 10.1186/1742-2094-9-185. - DOI - PMC - PubMed
    1. Politis M, Lahiri N, Niccolini F, Su P, Wu K, Giannetti P, Scahill RI, Turkheimer FE, Tabrizi SJ, Piccini P. Increased central microglial activation associated with peripheral cytokine levels in premanifest Huntington’s disease gene carriers. Neurobiol Dis. 2015;83:115-21. - PubMed

LinkOut - more resources