

Using collision cones to assess biological deconfliction methods
- PMID: 27655669
- PMCID: PMC5046949
- DOI: 10.1098/rsif.2016.0502
Using collision cones to assess biological deconfliction methods
Abstract
Biological systems consistently outperform autonomous systems governed by engineered algorithms in their ability to reactively avoid collisions. To better understand this discrepancy, a collision avoidance algorithm was applied to frames of digitized video trajectory data from bats, swallows and fish (Myotis velifer, Petrochelidon pyrrhonota and Danio aequipinnatus). Information available from visual cues, specifically relative position and velocity, was provided to the algorithm which used this information to define collision cones that allowed the algorithm to find a safe velocity requiring minimal deviation from the original velocity. The subset of obstacles provided to the algorithm was determined by the animal's sensing range in terms of metric and topological distance. The algorithmic calculated velocities showed good agreement with observed biological velocities, indicating that the algorithm was an informative basis for comparison with the three species and could potentially be improved for engineered applications with further study.
Keywords: animal behaviour; collision avoidance algorithm; collision cones; multi-species comparison; nonlinear control; velocity obstacles.
© 2016 The Author(s).
Figures
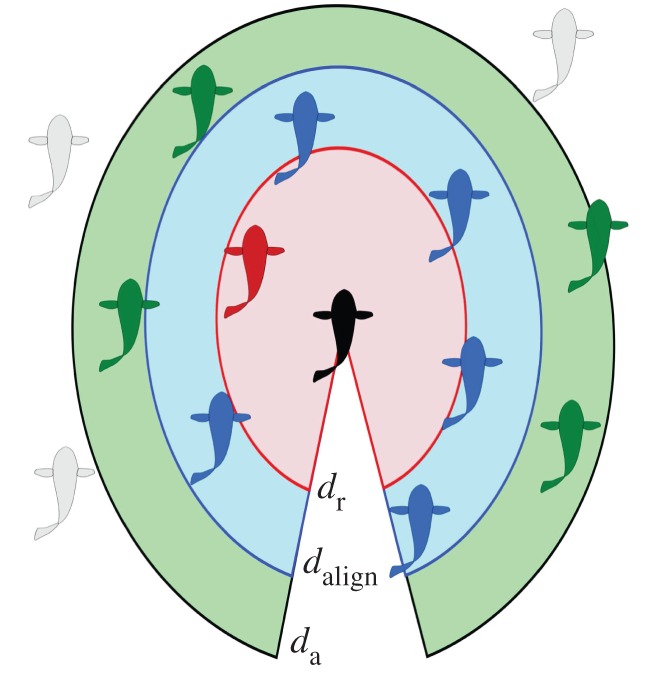
 (blue) are neutral or aligning, and those between
  and da (green) are attractive. Animals outside of da (grey) are not sensed or are ignored.
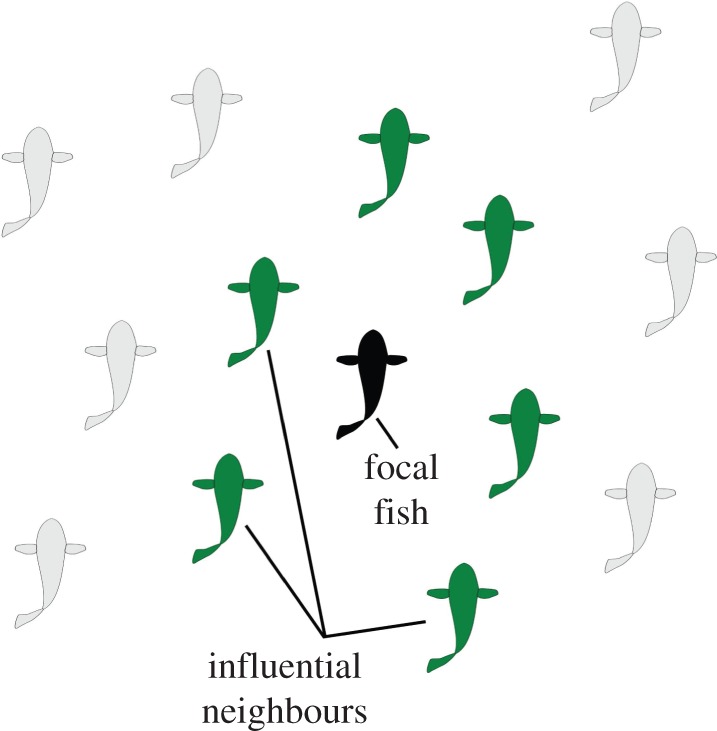
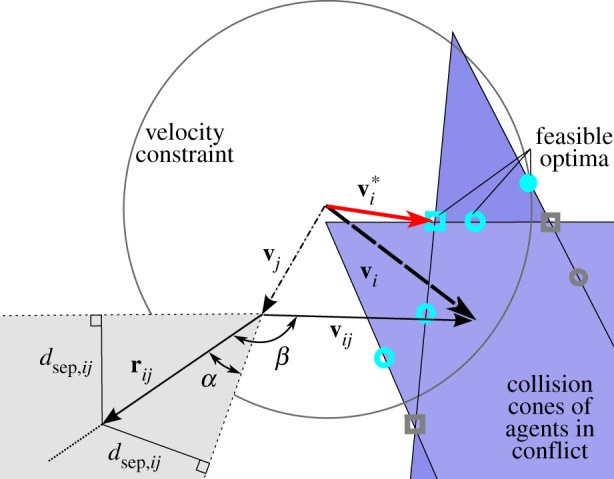
 indicates that
  falls outside the collision cone. The blue cones with solid borders depict collision cones for agents in conflict; potential optima are shown that are within the maximum velocity constraint (cyan) and as well as those that are infeasible (grey) at locations 1 and 2 on a single collision cone (open and closed circles, respectively) and location 3 on the intersection of collision cones (square).
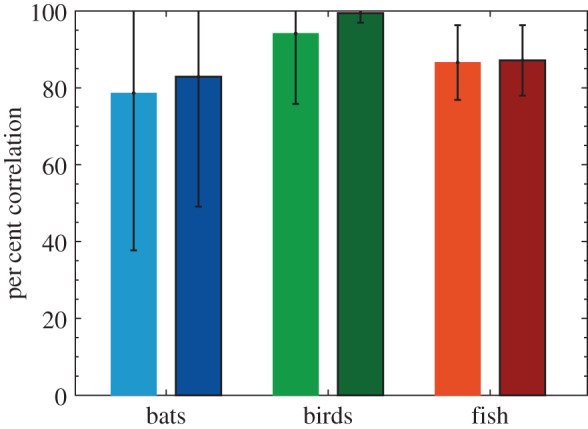
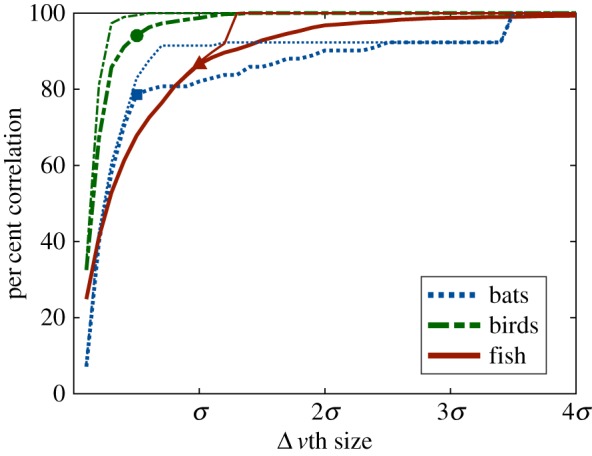
 for bats (blue dashed), birds (green dashed-dot) and fish (red solid) with (thin line) and without (thick line) acceleration limits applied to the DRCA optimal velocity; markers indicate values that appear in figures 9 and 11. The x-axis is scaled by the standard deviation for each species, which is 2 m s−1 for the flying species and 0.04 m s−1 for the fish.
References
-
- Reynolds CW. 1987. Flocks, herds, and schools: a distributed behavioral model. SIGGRAPH Comput. Graph. 21, 25–34. (10.1145/37402.37406) - DOI
-
- Stienessen SC, Parrish JK. 2013. The effect of disparate information on individual fish movements and emergent group behavior. Behav. Ecol. 24, 1150–1160. (10.1093/beheco/art042) - DOI
LinkOut - more resources
Full Text Sources
Other Literature Sources
