. 2016 Oct 15;197(8):3086-3098.
doi: 10.4049/jimmunol.1502031. Epub 2016 Sep 21.

Global Analysis of O-GlcNAc Glycoproteins in Activated Human T Cells

Affiliations

Global Analysis of O-GlcNAc Glycoproteins in Activated Human T Cells

Peder J Lund et al. J Immunol. .

Abstract

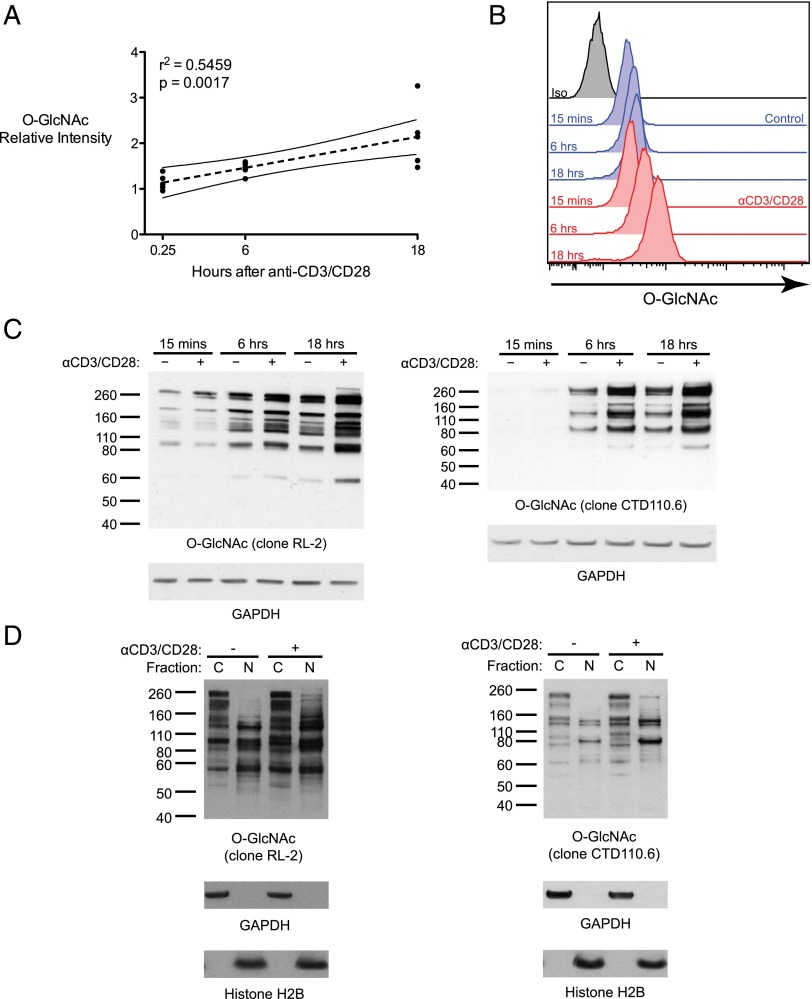
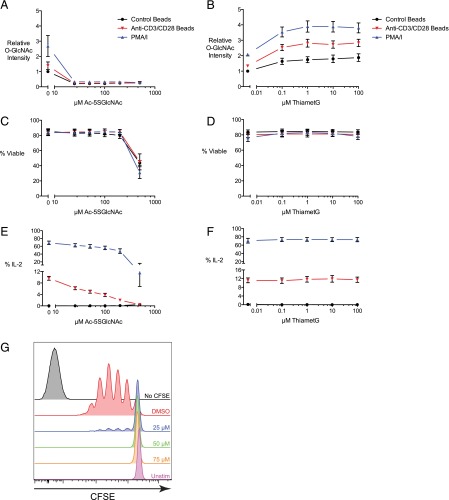
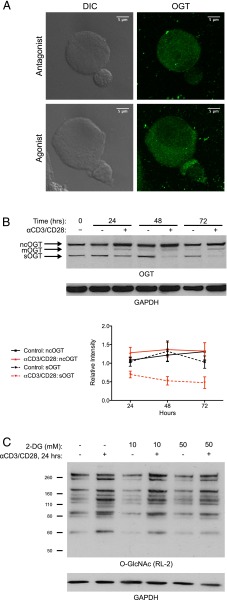
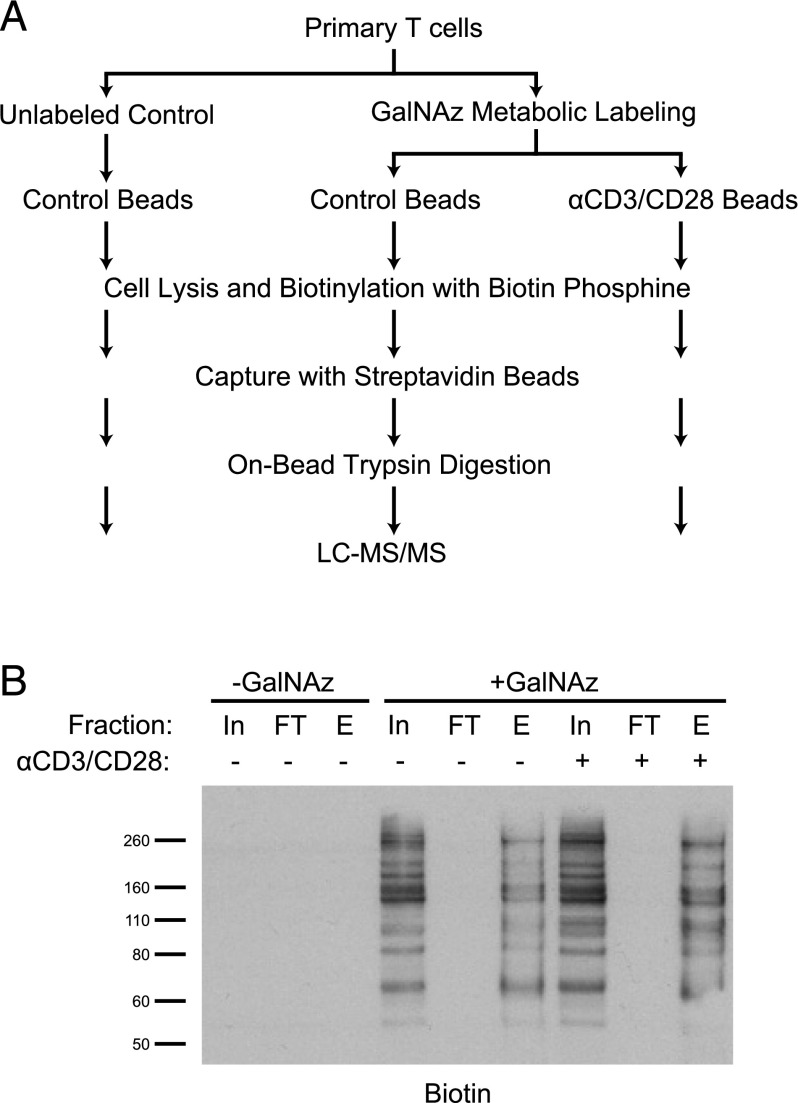
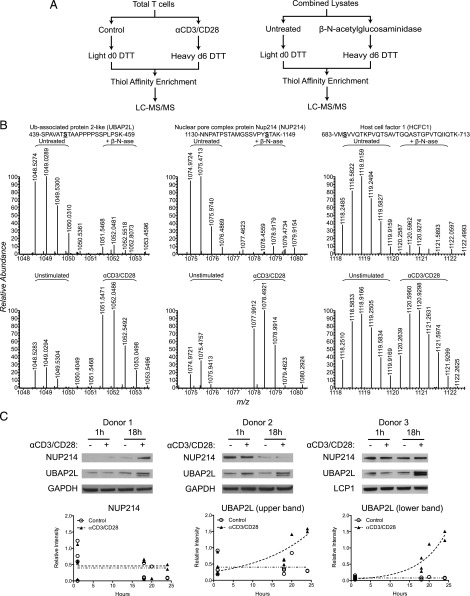
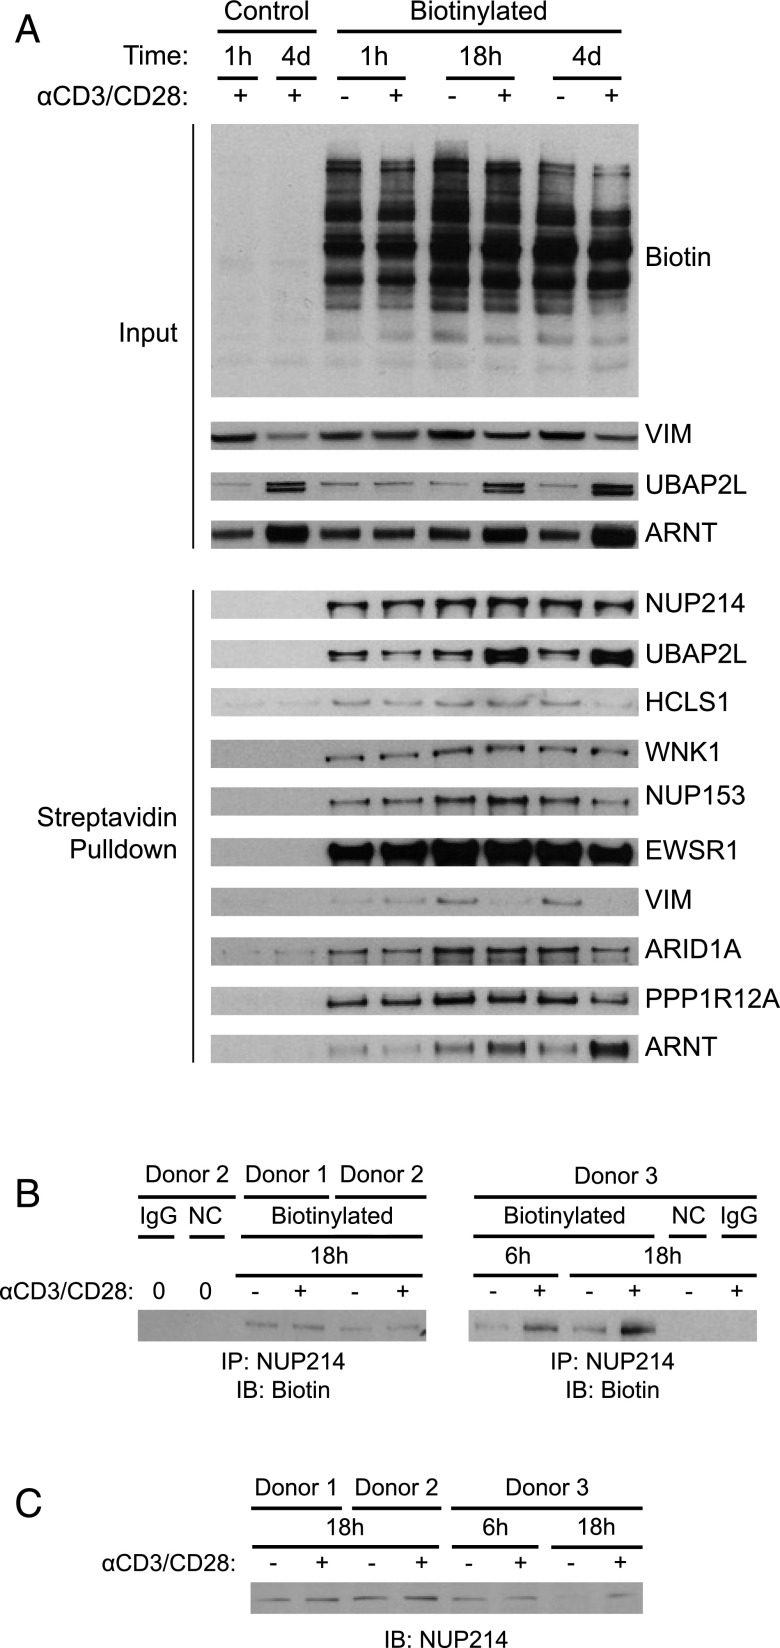
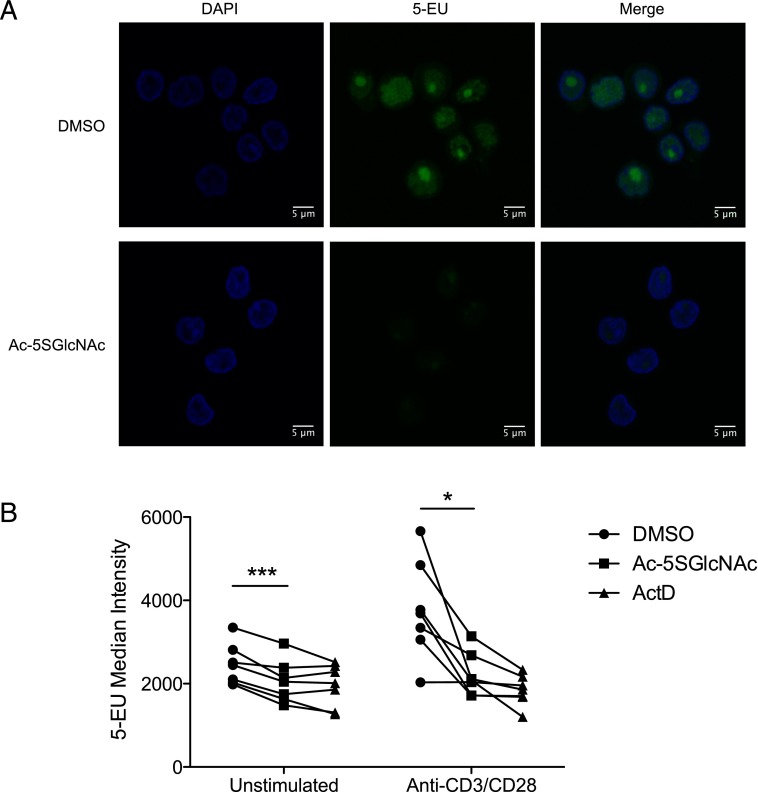
T cell activation in response to Ag is largely regulated by protein posttranslational modifications. Although phosphorylation has been extensively characterized in T cells, much less is known about the glycosylation of serine/threonine residues by O-linked N-acetylglucosamine (O-GlcNAc). Given that O-GlcNAc appears to regulate cell signaling pathways and protein activity similarly to phosphorylation, we performed a comprehensive analysis of O-GlcNAc during T cell activation to address the functional importance of this modification and to identify the modified proteins. Activation of T cells through the TCR resulted in a global elevation of O-GlcNAc levels and in the absence of O-GlcNAc, IL-2 production and proliferation were compromised. T cell activation also led to changes in the relative expression of O-GlcNAc transferase (OGT) isoforms and accumulation of OGT at the immunological synapse of murine T cells. Using a glycoproteomics approach, we identified >200 O-GlcNAc proteins in human T cells. Many of the identified proteins had a functional relationship to RNA metabolism, and consistent with a connection between O-GlcNAc and RNA, inhibition of OGT impaired nascent RNA synthesis upon T cell activation. Overall, our studies provide a global analysis of O-GlcNAc dynamics during T cell activation and the first characterization, to our knowledge, of the O-GlcNAc glycoproteome in human T cells.


Figures

FIGURE 1.
FIGURE 1.
Global levels of O-GlcNAc glycosylation increase after T cell activation. (A) Primary human T cells were incubated with control beads or anti-CD3/CD28 beads and then analyzed for O-GlcNAc by flow cytometry. The staining intensity of stimulated cells relative to control cells at each time point is plotted (five donors over three independent experiments) along with the mean and 95% confidence interval of a linear regression analysis. (B) Representative line graphs are shown for one donor. (C) Whole-cell lysates from control and stimulated T cells were analyzed for O-GlcNAc levels by immunoblot with anti-O-GlcNAc Ab RL-2 or CTD110.6. GAPDH served as a loading control. A total of at least two donors over at least two independent experiments were analyzed with similar results for each blot. (D) Cytosolic (C) and nuclear (N) extracts from T cells incubated with control beads or anti-CD3/CD28 beads for 18 h were analyzed for O-GlcNAc levels by immunoblot with anti–O-GlcNAc Ab RL-2 or CTD110.6. GAPDH and histone H2B served as controls for loading and compartmentalization. A total of three donors over two independent experiments were analyzed with similar results for each blot.
FIGURE 2.
FIGURE 2.
Activity of OGT, but not OGA, is necessary for T cell effector function. Primary human T cells were treated with the OGT inhibitor Ac-5SGlcNAc (A, C, and E) or the OGA inhibitor ThiametG overnight (B, D, and F) and then directly stimulated with anti-CD3/CD28 beads or PMA/ionomycin overnight in the continued presence of the inhibitors. Cells were analyzed for O-GlcNAc levels (A and B), viability (C and D), and IL-2 production (E and F) by flow cytometry. The plots of IL-2 and O-GlcNAc levels are gated on viable cells. Results are presented as the mean ± SEM of five donors across four experiments (A, C, and E) or four donors across three experiments (B, D, and F). O-GlcNAc staining intensity is expressed relative to unstimulated vehicle controls for each donor. (G) Human T cells were labeled with CFSE and then stimulated with anti-CD3/CD28 beads in the presence of increasing concentrations of Ac-5SGlcNAc. Proliferation was assessed after 3–4 d. Graphs are gated on viable cells. Results are representative of five donors across three experiments.
FIGURE 3.
FIGURE 3.
T cell activation leads to regulation of OGT localization and splicing. (A) Transgenic 5CC7 T cell blasts were incubated with CH27 B cells pulsed with MCC agonist or 99E antagonist peptide. After 50 min, cells were fixed, permeabilized, and stained for OGT for analysis by confocal microscopy. Results are representative of two independent experiments and incubation times from 10 to 60 min. (B) Primary human T cells were stimulated with control beads or anti-CD3/CD28 beads, and OGT protein levels were measured by immunoblot. A total of four donors over two independent experiments were analyzed. One blot is pictured. The ncOGT and sOGT bands on all blots were analyzed by densitometry and plotted. Data represent the mean band intensity ± SEM relative to GAPDH loading controls and normalized to the ncOGT or sOGT band intensity at the initial time point (0 h). (C) Primary human T cells were treated with increasing concentrations of 2-DG for 0–2 h prior to overnight stimulation with control beads or anti-CD3/CD28 beads in the continued presence of 2-DG. Whole-cell lysates were analyzed for O-GlcNAc levels by immunoblot. Similar results were obtained with two additional donors across two independent experiments using anti–O-GlcNAc Ab CTD110.6.
FIGURE 4.
FIGURE 4.
Metabolic labeling approach identifies O-GlcNAc proteins from human T cells. (A) Diagram illustrating the workflow for identification of O-GlcNAc proteins from T cells using metabolic labeling. (B) Primary human T cells from one donor were metabolically labeled with GalNAz and stimulated with control beads or anti-CD3/CD28 beads for 24 h. Azide-labeled proteins were then biotinylated for subsequent enrichment by streptavidin beads. Samples of the input (In) and flow-through (FT) material were analyzed by immunoblot to detect the biotin tag. Biotinylated protein was eluted (E) from an aliquot of the streptavidin beads to confirm capture.
FIGURE 5.
FIGURE 5.
Chemical labeling identifies O-GlcNAc sites enriched in activated T cells. (A) Diagrams illustrating the workflow for DTT isotope labeling to detect differences between control and activated T cells (left panel) or between samples with and without enzymatic removal of O-GlcNAc using β-N-acetylglucosaminidase (right panel). (B) MS1 spectra of peptides from UBAP2L, NUP214, and HCFC1. DTT-labeled residues are underlined in bold. Experiment comparing samples with and without enzymatic removal of O-GlcNAc (upper panels). Experiment comparing control and activated T cells after 18 h of stimulation (lower panels). For this experiment, lysates from three donors were pooled and labeled together. (C) Whole-cell lysates from control or activated T cells (six donors across four independent experiments, one or two time points each) were analyzed for the expression of NUP214 and UBAP2L by immunoblot. The individual results of three donors are shown (upper panels). The intensities of the NUP214 band and the two UBAP2L bands relative to loading controls (GAPDH or lymphocyte cytosolic protein 1 (LCP1)) are plotted below for all donors and time points. Dashed lines represent nonlinear regression analyses for the control and stimulated samples. The plots of the upper and lower UBAP2L bands have significantly nonzero slopes (p < 0.01, p < 0.0001) with r2 values of +0.63 and +0.89, respectively.
FIGURE 6.
FIGURE 6.
Blotting techniques verify mass spectrometry results. (A) O-GlcNAc proteins from control or activated T cells from one donor were enzymatically labeled, biotinylated, and enriched with streptavidin beads. Samples of unlabeled protein were also prepared by omitting the azide label to control for nonspecific labeling and enrichment. The enriched fractions were analyzed for the presence of the indicated proteins by immunoblot. (B) O-GlcNAc proteins from control or activated T cells (three donors across two independent experiments) were biotinylated as in (A). NUP214 was immunoprecipitated and analyzed for biotinylation by immunoblotting. An unlabeled sample served as a negative control (NC) for biotinylation, and a labeled sample immunoprecipitated with normal rabbit IgG served as a negative control for immunoprecipitation. Zero (0) indicates cells that were not treated with any beads. (C) Cell lysates from the three donors used in (B) were analyzed for NUP214 protein levels by immunoblotting with a different NUP214 Ab.
FIGURE 7.
FIGURE 7.
Inhibition of OGT blocks RNA synthesis. (A) Human T cells were cultured on glass coverslips coated with anti-CD3/CD28 for 24 h in the presence of 50 μM Ac-5SGlcNAc. 5-EU was added during the final 7 h of culture, and nascent RNA synthesis was subsequently visualized with Alexa Fluor 488 azide. Similar results were obtained with a second donor in an independent experiment using a 24-h 5-EU pulse. (B) Human T cells were treated with 50 μM Ac-5SGlcNAc overnight (24–28 h) and then stimulated with anti-CD3/CD28 beads or control beads overnight (18–22.5 h) in the presence of 5-EU. 5-EU was then labeled with Alexa Fluor 488, and cells were analyzed by flow cytometry. The median intensity of 5-EU staining is plotted for seven donors across three experiments with lines connecting data points from each donor. Cells treated with 2 μg/ml of the RNA polymerase inhibitor actinomycin D (ActD) during the 5-EU pulse served as negative controls and indicate the level of background staining *p < 0.05, ***p < 0.001, two-tailed, paired t test.

References

    1. Acuto O., Di Bartolo V., Michel F. 2008. Tailoring T-cell receptor signals by proximal negative feedback mechanisms. Nat. Rev. Immunol. 8: 699–712. - PubMed
    1. Smith-Garvin J. E., Koretzky G. A., Jordan M. S. 2009. T cell activation. Annu. Rev. Immunol. 27: 591–619. - PMC - PubMed
    1. Kabouridis P. S., Magee A. I., Ley S. C. 1997. S-acylation of LCK protein tyrosine kinase is essential for its signalling function in T lymphocytes. EMBO J. 16: 4983–4998. - PMC - PubMed
    1. Avni O., Lee D., Macian F., Szabo S. J., Glimcher L. H., Rao A. 2002. T(H) cell differentiation is accompanied by dynamic changes in histone acetylation of cytokine genes. Nat. Immunol. 3: 643–651. - PubMed
    1. Anandasabapathy N., Ford G. S., Bloom D., Holness C., Paragas V., Seroogy C., Skrenta H., Hollenhorst M., Fathman C. G., Soares L. 2003. GRAIL: an E3 ubiquitin ligase that inhibits cytokine gene transcription is expressed in anergic CD4+ T cells. Immunity 18: 535–547. - PubMed

Publication types

Substances

LinkOut - more resources