Clinical Trial
. 2016 Sep 21;8(357):357ra123.
doi: 10.1126/scitranslmed.aaf2341.

Cytokine-induced memory-like natural killer cells exhibit enhanced responses against myeloid leukemia

Affiliations
Clinical Trial

Cytokine-induced memory-like natural killer cells exhibit enhanced responses against myeloid leukemia

Rizwan Romee et al. Sci Transl Med. .

Abstract

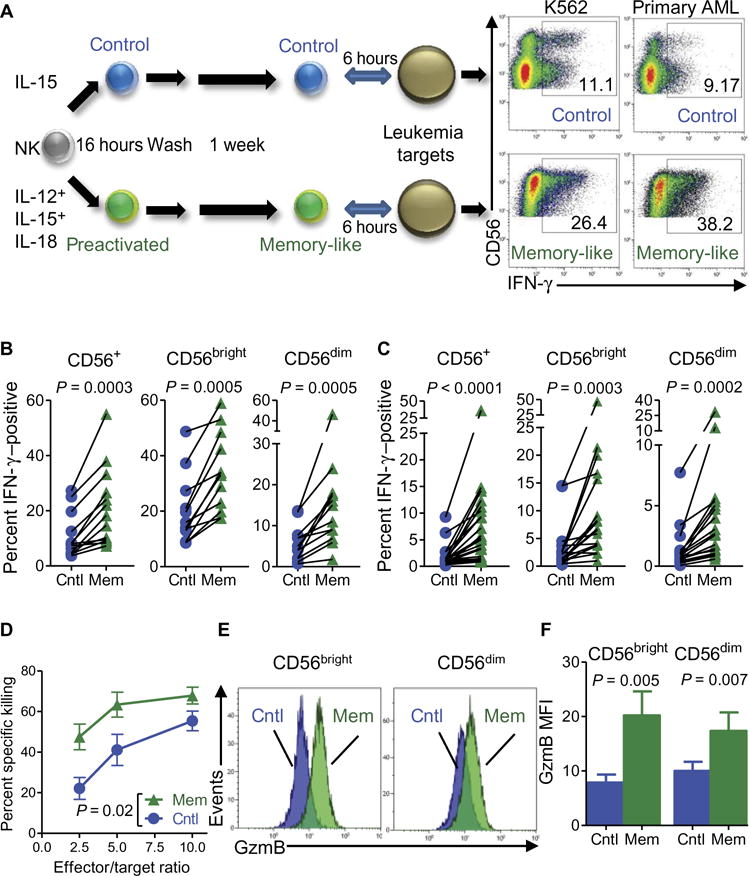
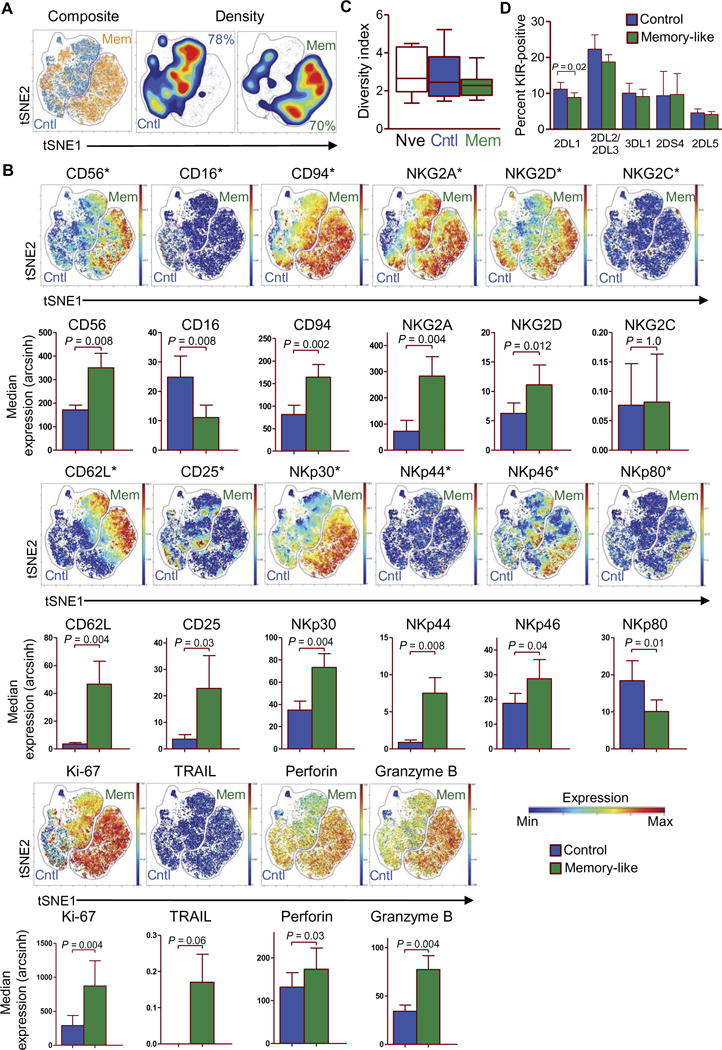
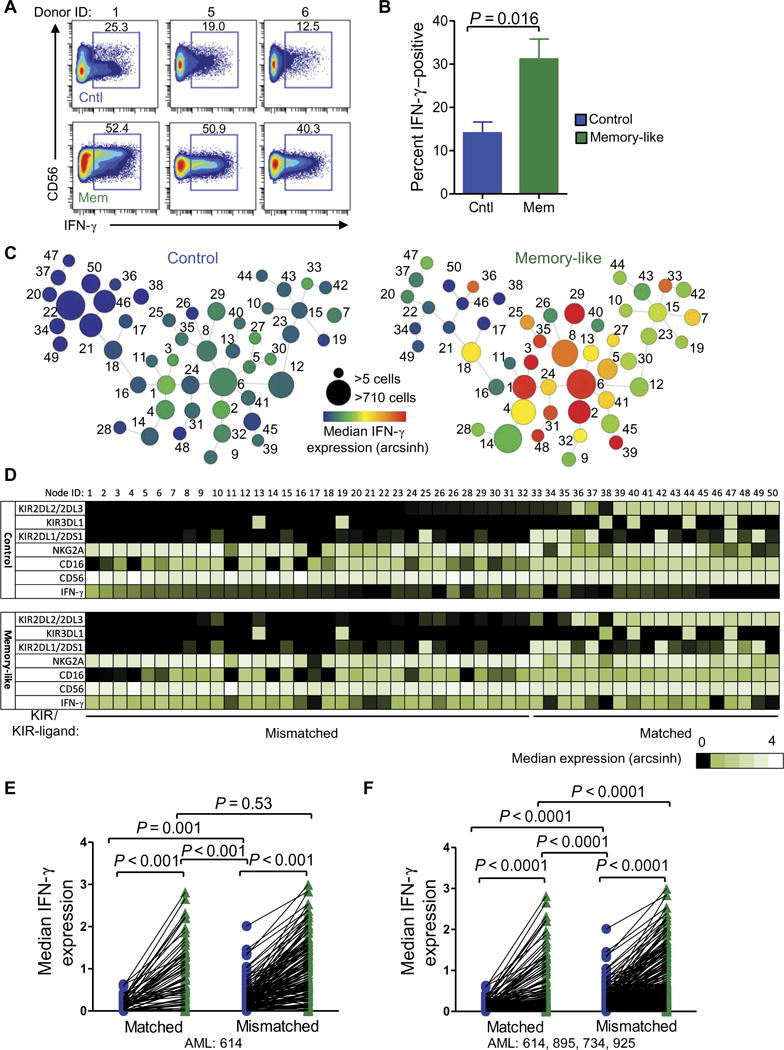
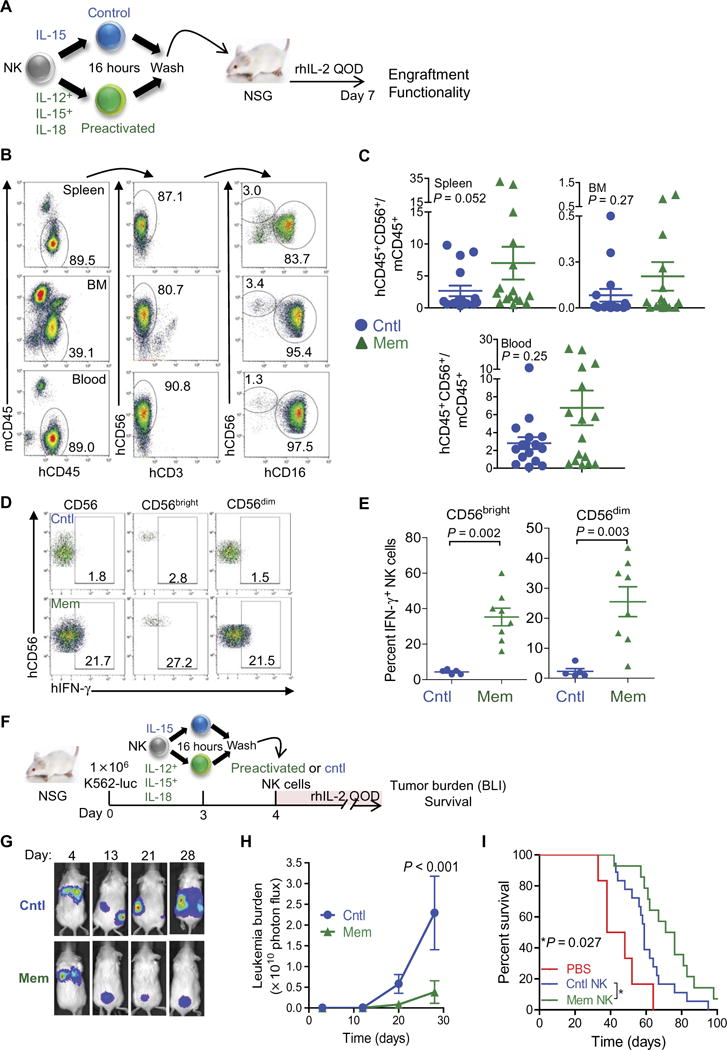
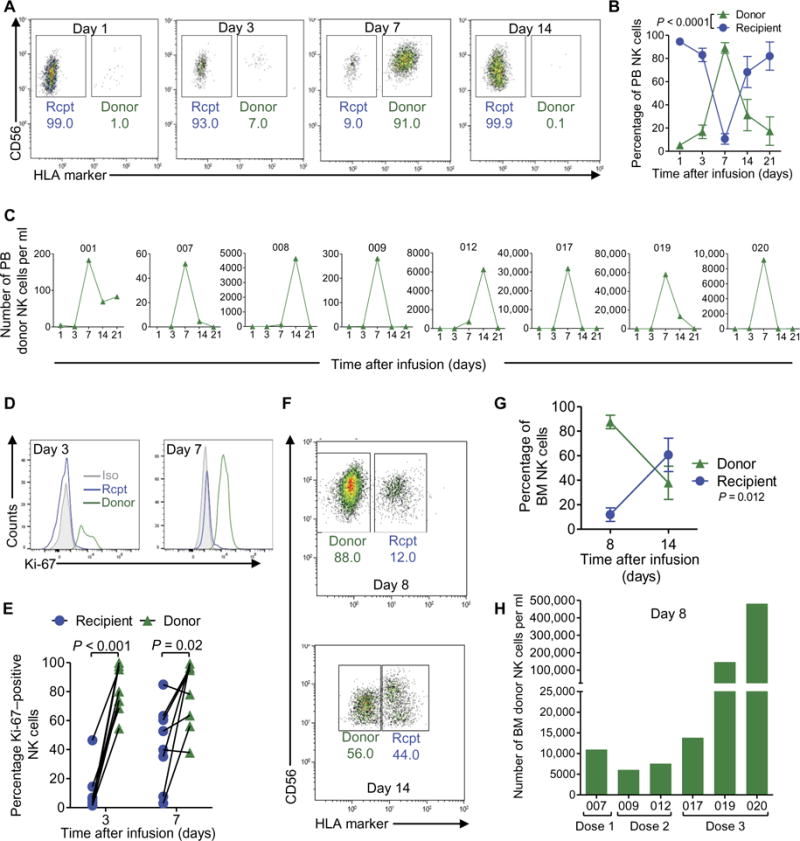
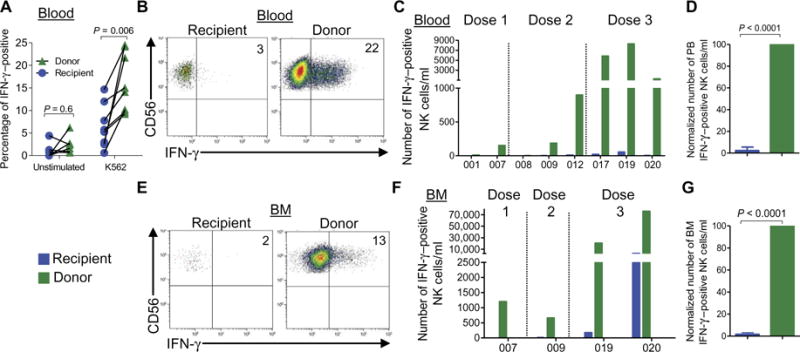
Natural killer (NK) cells are an emerging cellular immunotherapy for patients with acute myeloid leukemia (AML); however, the best approach to maximize NK cell antileukemia potential is unclear. Cytokine-induced memory-like NK cells differentiate after a brief preactivation with interleukin-12 (IL-12), IL-15, and IL-18 and exhibit enhanced responses to cytokine or activating receptor restimulation for weeks to months after preactivation. We hypothesized that memory-like NK cells exhibit enhanced antileukemia functionality. We demonstrated that human memory-like NK cells have enhanced interferon-γ production and cytotoxicity against leukemia cell lines or primary human AML blasts in vitro. Using mass cytometry, we found that memory-like NK cell functional responses were triggered against primary AML blasts, regardless of killer cell immunoglobulin-like receptor (KIR) to KIR-ligand interactions. In addition, multidimensional analyses identified distinct phenotypes of control and memory-like NK cells from the same individuals. Human memory-like NK cells xenografted into mice substantially reduced AML burden in vivo and improved overall survival. In the context of a first-in-human phase 1 clinical trial, adoptively transferred memory-like NK cells proliferated and expanded in AML patients and demonstrated robust responses against leukemia targets. Clinical responses were observed in five of nine evaluable patients, including four complete remissions. Thus, harnessing cytokine-induced memory-like NK cell responses represents a promising translational immunotherapy approach for patients with AML.


Conflict of interest statement

Competing interests: The authors declare that they have no competing interests.

Figures

Fig. 1
Fig. 1. Memory-like NK cells exhibit enhanced functional responses against leukemia targets
Purified NK cells were preactivated with IL-12, IL-15, and IL-18 or control (cntl; IL-15) for 16 hours, washed, and then rested in low concentrations of IL-15 to allow for differentiation. (A) Schema of memory-like (mem) NK cell in vitro experiments and representative flow plots showing enhanced IFN-γ production by NK cells after K562 (left) and primary AML (right) triggering. Inset numbers are the percentages of IFN-γ –positive NK cells within the indicated regions. (B and C) Summary of data showing enhanced IFN-γ production by all memory-like NK cells (CD56+) as well as each of the two major human NK cell subsets (CD56dim and CD56bright) restimulated with K562 (B) or primary allogeneic AML blasts (C). (D) Increased killing of K562 leukemia target cells by purified memory-like NK cells as compared to control NK cells from the same individuals. (E) Representative flow cytometry data showing increased granzyme B (GzmB) protein in memory-like compared to in control NK cells. (F) Summary of data from (E) showing granzyme B median fluorescence intensity (MFI). Data represent two to six independent experiments and were compared using Wilcoxon signed-rank test with means ± SEM displayed in all graphs.
Fig. 2
Fig. 2. Multidimensional analyses define the differences between memory-like and control NK cells
NK cells were assessed at baseline or after in vitro control and memory-like differentiation at day 7 (Fig. 1A) for the expression of 36 markers using mass cytometry. (A and B) Comparison of control and memory-like NK cells from a representative healthy individual using viSNE, clustered on 21 NK cell phenotypic markers. (A) Memory-like (orange) and control NK cell (blue) events overlaid in the tSNE1/tSNE2 fields (left) show their differential localization within the viSNE map. Density plots of control and memory-like NK cells in the tSNE1/tSNE2 fields (right). Inset values indicate the frequency of cells that fall within the control or memory-like gate. (B) The composite of the control and memory-like populations from (A), displaying the median expression of the indicated markers. Data are representative of nine individuals. Color scale indicates the intensity of expression of each marker signal. Minimum (min) and maximum (max) correspond to the 2nd and the 98th percentile values for each indicated marker, respectively. For additional summary data and statistical comparisons, see fig. S3. (C) Inhibitory KIR receptor inverse Simpson diversity index of baseline [naïve (nve)], control, and memory-like NK cells from nine individuals; box with whiskers displaying minimum to maximum. (D) Summary of data showing the percent positive of each indicated KIR for control and memory-like NK cells. All summary graphs display means ± SEM, unless otherwise indicated. Comparisons were made using Wilcoxon signed-rank test.
Fig. 3
Fig. 3. Response of memory-like NK cells to primary AML blasts is enhanced regardless of KIR-ligand interactions
Control and memory-like NK cells were stimulated with primary AML blasts for 6 hours and assessed for the expression of 36 markers using mass cytometry. (A) Representative bivariate mass cytometry plots of IFN-γ production by control and memory-like NK cells stimulated at the bulk population level. Numbers depict percentages of cells within the indicated regions. (B) Summary of data (means ± SEM) from seven individuals showing percentages of IFN-γ –positive NK cells. (C to E) NK cells were further analyzed on 21 clustering parameters using SPADE. (C) Representative SPADE diagram of in vitro–differentiated control and memory-like NK cells from a healthy individual. Node size depicts relative number of cells per node, and color indicates median IFN-γ expression for each node. Numbers next to each node represent the node ID. (D) Heat map of the nodes from (C). KIR to KIR-ligand matched and mismatched status was assigned on the basis of the presence or absence of KIR2DL2/KIR2DL3, which recognizes HLA-C1 expressed by the primary AML. (E) Summary of data from seven individuals analyzed as in (C). (F) Summary of data from four to seven different individuals stimulated with four different AML blasts showing reproducibility of these findings. Control and memory-like data were compared using the Wilcoxon signed-rank test. Matched and mismatched data were compared using the Mann-Whitney test.
Fig. 4
Fig. 4. Human memory-like NK cells control human leukemia in an NSG xenograft model
(A) Experimental design for (B) to (E). rhIL-2, recombinant human IL-2; QOD, every other day. (B to E) NSG mice received human NK cell adoptive transfers as indicated in (A). Representative flow cytometry at day 7 after transfer shows engraftment of human memory-like NK cells in the indicated tissues from a representative donor. Both CD56bright and CD56dim subsets are detectable. (C) Summary of data from (B) demonstrating the engraftment of control and memory-like NKcells, with abundance identified as the ratio to murine CD45+ mononuclear cells. (D) Control or memory-like NK cells were administered to NSG mice as in (A). After 7 days, splenocytes were isolated and restimulated with K562 for 6 hours, followed by assessment of human NK cells for IFN-γ production. Numbers depict the percentages of cells within the indicated regions. (E) Summary of data from (D) showing the means ± SD of percent IFN-γ –positive NK cells from the indicated NK cell subsets. Statistical analysis was performed with Mann-Whitney test. (F) Experimental design for (G) to (I). (G to I) K562-luc was injected intravenously into NSG mice. After 4 days, BLI was performed to ensure leukemia engraftment, and control or memory-like NK cells were administered to the mice. The mice were treated with rhIL-2 every other day and monitored for tumor burden (BLI) and survival. (G) Representative BLI of recipient mice engrafted with K562-luc on the indicated day after tumor administration. (H) Summary of serial BLI measurements that show reduced tumor burden in mice receiving memory-like NK cells compared to control NK cells. Differences were determined using analysis of variance (ANOVA). (I) Mice were treated as in (F), monitored for survival, and analyzed using the log-rank test. PBS, phosphate-buffered saline. Summary data are from two to three experiments with n = 12 to 24 mice per group represented as means ± SEM.
Fig. 5
Fig. 5. Donor memory-like NK cells expand and proliferate in vivo in AML patients
(A) Representative flow cytometry data of donor (HLA+) versus recipient (rcpt) (HLA) NK cells on the indicated day after infusion. (B) Percentages of the peripheral blood (PB) NK cell compartment composed of donor versus recipient NK cells at the indicated time points after infusion, summarizing the eight patients with informative HLA mAbs available for all time points. (C) Absolute numbers of donor NK cells per milliliter of peripheral blood at the indicated times after infusion for each patient (UPN above individual graphs). Absolute numbers were calculated by multiplying the number of mono-nuclear cells obtained per milliliter of blood by the fraction of CD45+ cells that consisted of donor NK cells. (D) Representative flow cytometry data showing Ki-67 staining in donor and recipient NK cells from the peripheral blood on the indicated day after infusion. Isotype control (iso) staining for Ki-67 is indicated by the gray histogram. (E) Summary of data of the percentages of Ki-67–positive donor versus recipient peripheral blood NK cells at days 3 and 7 after infusion. (F) Representative flow cytometry data of donor (HLA) versus recipient (HLA+) NK cells on the indicated day after infusion. (G) Percentages of the BM NK cell compartment that were donor versus recipient NK cells at the indicated time point after infusion, summarizing the seven patients with informative HLA mAbs available for all time points. (H) Absolute numbers of donor and recipient NK cells per milliliter of BM at day 8 after infusion. Absolute numbers were obtained as in (C). Statistical comparison was performed by two-way ANOVA. In representative bivariate flow plots (A and F), numbers indicate the frequency of cells within the indicated gate.
Fig. 6
Fig. 6. Donor memory-like NK cells display enhanced antileukemia responses at 1 week after adoptive transfer
Freshly isolated peripheral blood mononuclear cells (PBMCs) from patient blood or BM were stimulated with K562 leukemia cells at an effector/target ratio of 10:1 for 6 hours and assessed for IFN-γ production by flow cytometry. (A) Percentage of IFN-γ – positive donor versus recipient NK cells in the peripheral blood for all patients. Data were compared using paired t test. (B) Representative flow cytometric data showing donor and recipient NK cell IFN-γ responses from theperipheralblood.(C)Absolutenumbersofrecipient(blue)anddonor(green) NK cells producing IFN-γ in the blood. (D) Summary of data from (C) depicting relative IFN-γ production by recipient and donor NK cells from the blood; the data were normalized to donor IFN-γ –positive NK cells, which were set to 100%. (E) Representative flow cytometry data showing donor and recipient NK cell IFN-γ responses from the BM. (F) Absolute numbers of recipient and donor NK cells producing IFN-γ in the BM. (G) Summary of data from (F) depicting relative IFN-γ production by recipient and donor NK cells from the BM; the data were normalized to donor IFN-γ –positive NK cells, which were set to 100%. Normalized control NK cell responses were tested against 100% (donor) using a one-sample t test. Numbers represent percentage of cells within the indicated quadrant. All summary data depict means ± SEM.

References

    1. Juliusson G, Antunovic P, Derolf Å, Lehmann S, Möllgård L, Stockelberg D, Tidefelt U, Wahlin A, Höglund M. Age and acute myeloid leukemia: Real world data on decision to treat and outcomes from the Swedish Acute Leukemia Registry. Blood. 2009;113:4179–4187. - PubMed
    1. Estey E, Döhner H. Acute myeloid leukaemia. Lancet. 2006;368:1894–1907. - PubMed
    1. Rowe JM, Tallman MS. How I treat acute myeloid leukemia. Blood. 2010;116:3147–3156. - PubMed
    1. Döhner H, Estey E, Amadori S, Appelbaum FR, Büchner T, Burnett AK, Dombret H, Fenaux P, Grimwade D, Larson RA, Lo-Coco F, Naoe T, Niederwieser D, Ossenkoppele GJ, Sanz MA, Sierra J, Tallman MS, Löwenberg B, Bloomfield CD. Diagnosis and management of acute myeloid leukemia in adults: Recommendations from an international expert panel, on behalf of the European LeukemiaNet. Blood. 2010;115:453–474. - PubMed
    1. Mrózek K, Marcucci G, Nicolet D, Maharry KS, Becker H, Whitman SP, Metzeler KH, Schwind S, Wu Y-Z, Kohlschmidt J, Pettenati MJ, Heerema NA, Block AW, Patil SR, Baer MR, Kolitz JE, Moore JO, Carroll AJ, Stone RM, Larson RA, Bloomfield CD. Prognostic significance of the European LeukemiaNet standardized system for reporting cytogenetic and molecular alterations in adults with acute myeloid leukemia. J Clin Oncol. 2012;30:4515–4523. - PMC - PubMed

Publication types