. 2016 Oct 4;113(40):11226-11231.
doi: 10.1073/pnas.1606943113. Epub 2016 Sep 21.

How curvature-generating proteins build scaffolds on membrane nanotubes

Affiliations

How curvature-generating proteins build scaffolds on membrane nanotubes

Mijo Simunovic et al. Proc Natl Acad Sci U S A. .

Abstract

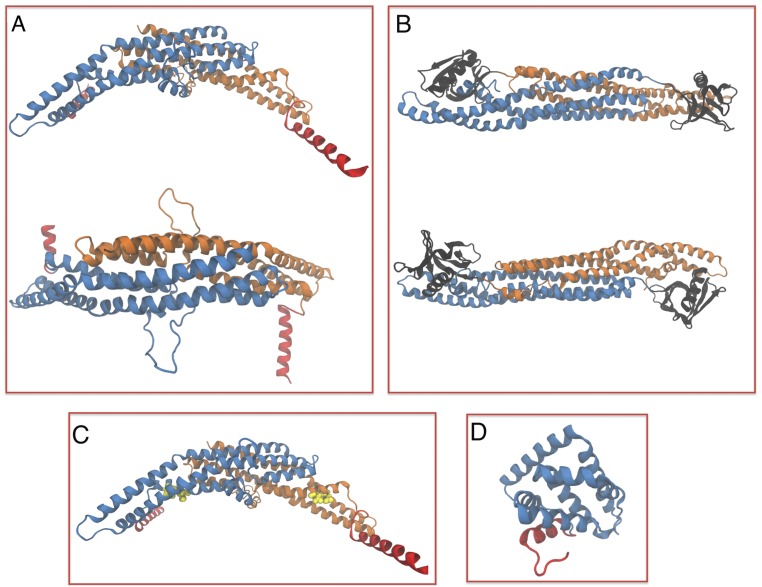
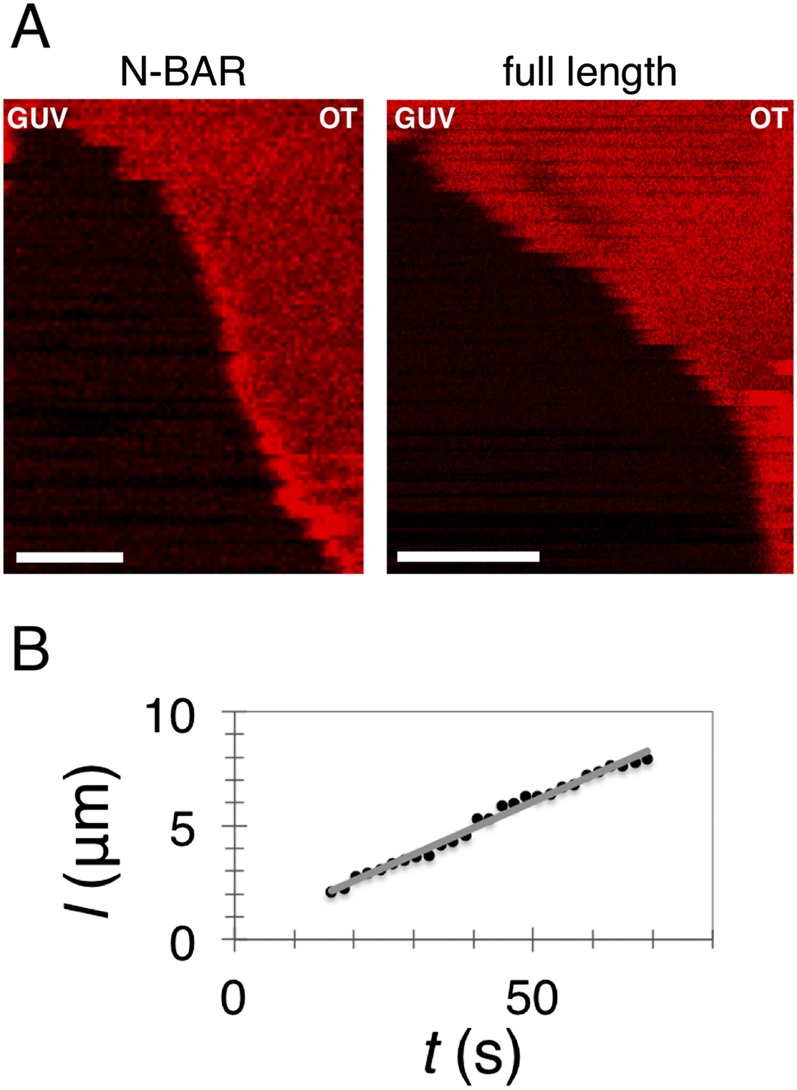
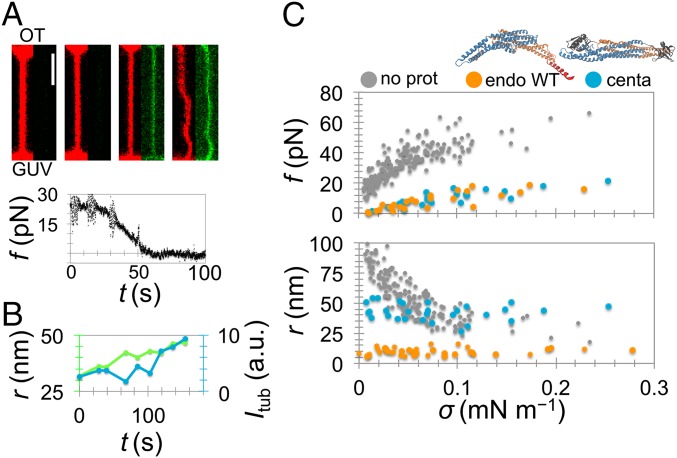
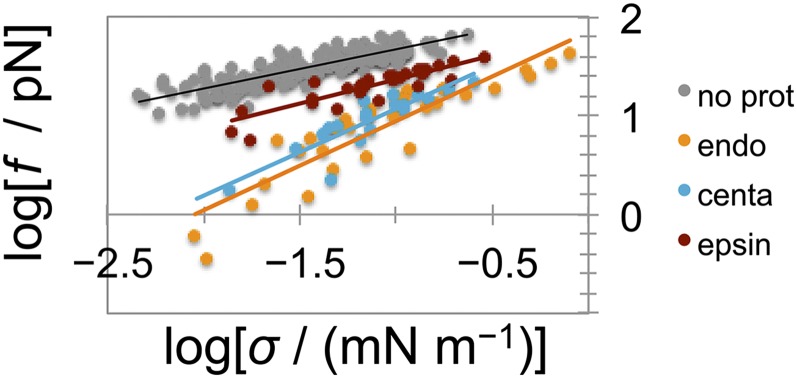
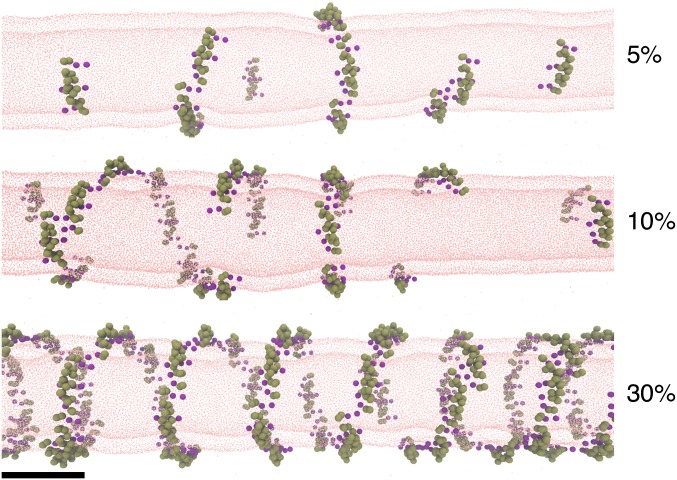
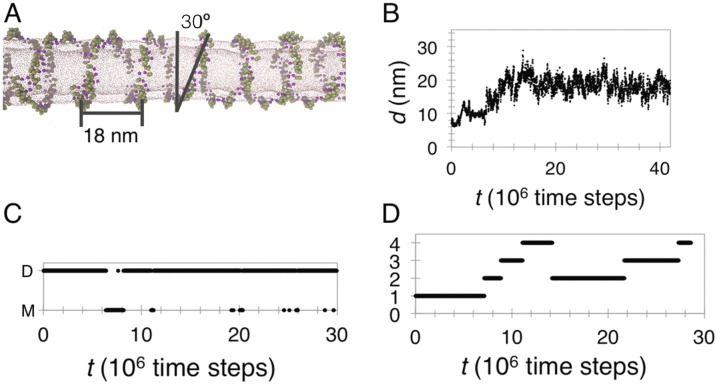
Bin/Amphiphysin/Rvs (BAR) domain proteins control the curvature of lipid membranes in endocytosis, trafficking, cell motility, the formation of complex subcellular structures, and many other cellular phenomena. They form 3D assemblies that act as molecular scaffolds to reshape the membrane and alter its mechanical properties. It is unknown, however, how a protein scaffold forms and how BAR domains interact in these assemblies at protein densities relevant for a cell. In this work, we use various experimental, theoretical, and simulation approaches to explore how BAR proteins organize to form a scaffold on a membrane nanotube. By combining quantitative microscopy with analytical modeling, we demonstrate that a highly curving BAR protein endophilin nucleates its scaffolds at the ends of a membrane tube, contrary to a weaker curving protein centaurin, which binds evenly along the tube's length. Our work implies that the nature of local protein-membrane interactions can affect the specific localization of proteins on membrane-remodeling sites. Furthermore, we show that amphipathic helices are dispensable in forming protein scaffolds. Finally, we explore a possible molecular structure of a BAR-domain scaffold using coarse-grained molecular dynamics simulations. Together with fluorescence microscopy, the simulations show that proteins need only to cover 30-40% of a tube's surface to form a rigid assembly. Our work provides mechanical and structural insights into the way BAR proteins may sculpt the membrane as a high-order cooperative assembly in important biological processes.

Keywords: BAR proteins; endocytosis; membrane curvature; protein scaffold; self-assembly.


Conflict of interest statement

The authors declare no conflict of interest.

Figures

Fig. S1.
Fig. S1.
Protein surface density calibration. The HPC* lipid fluorescence intensity scales linearly with its concentration in bulk (A) and in GUVs (B). (C) The fluorescence intensity of Alexa488 (bound to a protein) scales linearly with its bulk fluorescence intensity. The slopes of plots are used to calculate the absolute surface density of proteins. Measurements shown are for specific detection gain and laser power output.
Fig. S2.
Fig. S2.
The mechanics of the total lipid brain extract membrane supplemented with 5% PI(4,5)P2. (A) Tube-retraction force f (Left) and tube radius r (Right) as a function of membrane tension, σ, for a single GUV. The experiment was performed by first stepwise increasing σ (black dots) then stepwise decreasing it (gray dots). Then, we injected the experimental buffer first stepwise increasing σ (blue triangles) then again decreasing it (light blue triangles). There is almost complete superposition. Note that in the first radius measurement (light gray dot that deviates) the tube was not in focus. (B) Shown are fits of Eq. S1 (Left) and Eq. S2 (Right) to our data. Number of independent vesicles: 45 (Left) and 36 (Right). Tube radius was measured from the lipid fluorescence.
Fig. S3.
Fig. S3.
Phase behavior of the membrane. (A) Homogeneous distribution of the lipid dyes in the total lipid brain extract vesicles, indicating no phase separation. (B) The absence of lipid sorting on a curved membrane. Tube radius of curvature, c, is calculated from the force; the sorting, S, is adjusted by the polarization factor. Shown is representative of four different experiments. (Scale bar, 2 µm.)
Fig. 1.
Fig. 1.
Scaffolding by endophilin A2. (A) Endophilin A2 N-BAR domain (endo) (amino acids 1–247) binds to the tube’s base and forms a scaffold that continuously grows along the tube [note the progressive constriction in the tube radius from the GUV toward the optical trap (OT, white circle)]. (B) A kymogram of scaffold growth from the GUV to the bead (fluorescence dims near the end as the tube buckles in and out of focus). Lipid and protein channels are overlaid. The plot shows tube-retraction force, f, as a function of time, t. The x axis of the kymogram coincides with the x axis of the plot. (C) Time lapse of a striated pattern induced by endophilin A2 N-BAR domain. t = 0 marks the time when protein was detected on the tube. (All scale bars, 2 μm.)
Fig. S4.
Fig. S4.
X-ray and homology modeling structures of proteins used in the study. (A) Homology modeling of the N-BAR domain of endophilin A2. (B) Homology modeling of BAR and PH domains of β2 centaurin. For A and B, proteins viewed from the side (top) and above the membrane surface (bottom). (C) Endophilin A2 E37K, D41K (mutated residues colored yellow). (D) Crystal structure of the epsin N-terminal homology domain of epsin 1 (PDB ID code 1EDU). Blue and orange color coding based on monomer; red, N-terminal helices and black, PH domain.
Fig. S5.
Fig. S5.
Scaffolding by endophilin A2. (A) Kymograms of membrane tubes scaffolded by full-length endophilin A2 (Right) and N-BAR domain of endophilin A2 (Left). Lipids are fluorescent. The diminishment of fluorescence indicates a constriction of the membrane tube to r ∼10 nm (i.e., the formation of a scaffold). (Scale bars, 2 µm.) (B) An example measuring scaffold length as a function of time; the gray line is a linear fit.
Fig. 2.
Fig. 2.
Scaffolding by N-BAR versus BAR domains. (A) β2 centaurin BAR domain (amino acids 1–384) binds evenly along the tube (red, lipid and green, protein) and causes a decrease in tube-retraction force, f, just like endophilin. (Scale bar, 2 μm.) (B) Dilation of a narrow tube induced by a scaffold of β2 centaurin BAR domain (overlaid are fluorescence intensity of the protein on the tube, Itub, and the tube radius, r, deduced from lipid fluorescence). (C) The mechanics of the reference membrane (n = 45) and after the formation of a scaffold by endophilin A2 WT (endo WT, n = 7) and β2 centaurin (centa, n = 5). Tube force, f, measured from the optical trap; tube radius, r, measured from lipid fluorescence.
Fig. S6.
Fig. S6.
Scaling of force with membrane tension. Linear fit yields slopes for bare membrane (gray), 0.41 ± 0.02; for endophilin A2 scaffold (orange), 0.90 ± 0.08; for β2 centaurin scaffold (blue), 0.88 ± 0.12; and for epsin 1 (red), 0.49 ± 0.06.
Fig. 3.
Fig. 3.
Amphipathic helices do not determine the scaffold initiation site. Shown are force plots (white) overlaid on kymograms of lipid fluorescence of a membrane nanotube (red marker) during binding and scaffolding by endophilin mutants. As before, the formation of a scaffold is evident from tube constriction. (Left) Scaffolding by endophilin A2 with truncated N-terminal helices (endo ΔH0). (Right) Scaffolding by endophilin A2 N-BAR domain E37K, D41K (endo mut).
Fig. S7.
Fig. S7.
Epsin 1 alters membrane curvature and mechanics. Shown are the force and the tube radius after injecting epsin 1 at bulk concentrations of 2–5 µM (n = 5).
Fig. 4.
Fig. 4.
Strongly curving proteins nucleate at the base of a pinned and fluctuating tube. Mathematical model: strain energy variation profile, E, as a function of the axial position on the tube, z (in percentage of total length), plotted using Δσ = 0.25% (orange) and 0.05% (blue), κ = 50 kBT, L/r = 100.
Fig. S8.
Fig. S8.
Mechanical strain energy profiles of protein-adsorbed pinned tubes. Plotted are mechanical strain energy, E, (in kBT units) versus the z coordinate (in L/100 units, where L is the tube length). (A) The effect of the spontaneous curvature, C0, (in [r−1] units), for a tension perturbation of Δσ = 1%. (B) The effect of Δσ, for the case of C0 = 0.45 r−1. Half-tube is shown, the profile being symmetric with respect to the tube’s center.
Fig. 5.
Fig. 5.
Simulation of N-BAR domains on nanotubes. Shown are final snapshots of CG MD simulations of membrane tubes coated with N-BAR proteins at the indicated protein surface densities. (Scale bar, 20 nm.)
Fig. S9.
Fig. S9.
The formation of an N-BAR domain helix. (A) Structural properties of the helix from a CG simulation at 35% N-BAR density. (B) The distance between two representative N-BAR domains showing the convergence to the helical pitch distance. Taken from CG simulation at 35% density. (C) Dimerization kymogram showing the dimerization dynamics of two N-BAR domains as part of the helix at 35% density. M, monomer; D, dimer. (D) Polymerization kymogram, showing the dynamics of helix formation in a simulation at 12% density. Numbers on the y axis represent the number of N-BAR domains in the helix.

References

    1. McMahon HT, Gallop JL. Membrane curvature and mechanisms of dynamic cell membrane remodelling. Nature. 2005;438(7068):590–596. - PubMed
    1. Phillips R, Ursell T, Wiggins P, Sens P. Emerging roles for lipids in shaping membrane-protein function. Nature. 2009;459(7245):379–385. - PMC - PubMed
    1. Mim C, Unger VM. Membrane curvature and its generation by BAR proteins. Trends Biochem Sci. 2012;37(12):526–533. - PMC - PubMed
    1. Qualmann B, Koch D, Kessels MM. Let’s go bananas: Revisiting the endocytic BAR code. EMBO J. 2011;30(17):3501–3515. - PMC - PubMed
    1. Suetsugu S, Toyooka K, Senju Y. Subcellular membrane curvature mediated by the BAR domain superfamily proteins. Semin Cell Dev Biol. 2010;21(4):340–349. - PubMed

Publication types

LinkOut - more resources