. 2016 Nov;204(3):933-958.
doi: 10.1534/genetics.116.188953. Epub 2016 Sep 21.

Incorporating Functional Annotations for Fine-Mapping Causal Variants in a Bayesian Framework Using Summary Statistics

Affiliations

Incorporating Functional Annotations for Fine-Mapping Causal Variants in a Bayesian Framework Using Summary Statistics

Wenan Chen et al. Genetics. 2016 Nov.

Abstract

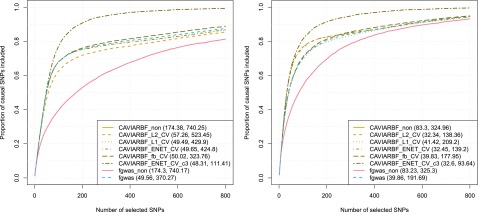
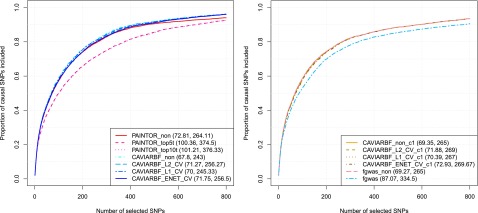
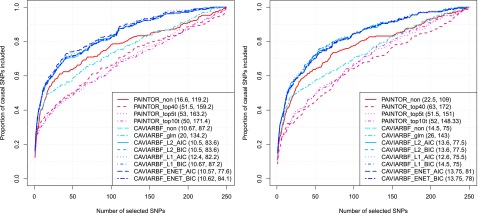
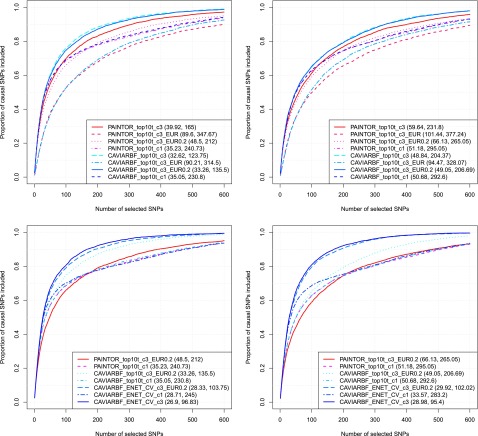
Functional annotations have been shown to improve both the discovery power and fine-mapping accuracy in genome-wide association studies. However, the optimal strategy to incorporate the large number of existing annotations is still not clear. In this study, we propose a Bayesian framework to incorporate functional annotations in a systematic manner. We compute the maximum a posteriori solution and use cross validation to find the optimal penalty parameters. By extending our previous fine-mapping method CAVIARBF into this framework, we require only summary statistics as input. We also derived an exact calculation of Bayes factors using summary statistics for quantitative traits, which is necessary when a large proportion of trait variance is explained by the variants of interest, such as in fine mapping expression quantitative trait loci (eQTL). We compared the proposed method with PAINTOR using different strategies to combine annotations. Simulation results show that the proposed method achieves the best accuracy in identifying causal variants among the different strategies and methods compared. We also find that for annotations with moderate effects from a large annotation pool, screening annotations individually and then combining the top annotations can produce overly optimistic results. We applied these methods on two real data sets: a meta-analysis result of lipid traits and a cis-eQTL study of normal prostate tissues. For the eQTL data, incorporating annotations significantly increased the number of potential causal variants with high probabilities.

Keywords: Bayesian fine mapping; annotations; causal variants; summary statistics.


Figures

Figure 1
Figure 1
Hierarchical models incorporating functional annotations. The box indicates the added modeling block related to annotations. Shaded ○ indicates observed data. A, the annotation matrix of variants; c, the causal configuration vector of variants; G, full genotype matrix; Y, phenotype vector; β, effect size vector of genotypes on the phenotype; σa, the parameter specifying the prior distribution of β; γ, the effect size vector of annotations on the causality state; λ, the parameter specifying the prior distribution of γ.
Figure 2
Figure 2
Hierarchical models of K loci incorporating functional annotations. All K loci share the same annotation effects. Shaded ○ indicates observed data. The definitions of symbols are the same as in Figure 1 except the extra subscript indicating the locus index. There are three different models depending on the input data: (A) full genotype and a single phenotype, e.g., a GWAS data set; (B) full genotype and multiple phenotypes for each locus, e.g., a eQTL data set; (C) marginal test statistics and correlations among variants for each locus, which can be derived from either a GWAS data set or an eQTL data set.
Figure 3
Figure 3
Proportion of causal variants identified by different methods. The top panels correspond to 20 initial loci (∼12 causal loci) and the bottom 5panels correspond to 100 initial loci (∼65 causal loci). The left column corresponds to 5 informative annotations with large effects, and the right column corresponds to 40 informative annotations with moderate effects. The numbers shown in the parentheses correspond to the average number of SNPs required to identify 50 and 80% of the causal SNPs, respectively.
Figure 4
Figure 4
PIP calibration with 100 initial loci (∼65 causal loci). The top two panels show results from CAVIARBF_ENET_CV, bottom two panels are from PAINTOR_top5t. Left two panels, 5 informative annotations with effect size log5; right two panels, 40 informative annotations with effect size log1.5. The x-axis shows the center of 20 bins of width 0.05. The y-axis is the proportion of causal SNPs. The blue points show the proportion of causal SNPs in each bin. The red bars show the 95% C.I. (Wilson inversion of score statistic) of the proportion assuming a binomial distribution in each bin. 100 data sets were used in each panel.
Figure 5
Figure 5
Proportion of causal variants identified by CAVIARBF and fgwas. The left panel corresponds to 5 informative annotations with large effects, and the right panel corresponds to 40 informative annotations with moderate effects. The numbers shown in the parentheses correspond to the average number of SNPs required to identify 50 and 80% of the causal SNPs, respectively. CAVIARBF_ENET_CV_c3 assumes three causal variants.
Figure 6
Figure 6
Proportion of causal variants identified when the annotation effect size is zero. The left panel shows comparison between PAINTOR and CAVIARBF assuming three maximal causal variants. The right panel shows comparison between fgwas and CAVIARBF assuming one causal variant.
Figure 7
Figure 7
Proportion of causal variants identified when there is only one locus. The left column corresponds to 5 informative annotations with large effects, and the right column corresponds to 40 informative annotations with moderate effects. The numbers shown in the parentheses correspond to the average number of SNPs required to identify 50 and 80% of the causal SNPs, respectively.
Figure 8
Figure 8
Proportion of causal variants identified with and without the true correlation matrix or with reference correlation matrix. The two panels on the left correspond to 5 informative annotations with effect size log5, and the two on the right correspond to 40 informative annotations with effect size log1.5. The numbers shown in the parentheses correspond to the average number of SNPs required to identify 50 and 80% of the causal SNPs, respectively. c3 and c1 indicates that the maximal number of causal variants is 3 or 1, respectively. EUR means using the correlation matrix calculated from the EUR population in the 1000 Genomes Project and EUR0.2 means adding 0.2 to the main diagonal of the correlation matrix calculated from the EUR population.
Figure 9
Figure 9
PIP calibration of CAVIARBF _ENET_CV_c3_EUR0.2 (two top panels), CAVIARBF _ENET_CV_c1 (two middle panels), and PAINTOR _top10t_c1 (two bottom panels). c3 and c1 indicates that the maximal number of causal variants is 3 or 1, respectively. EUR0.2 means adding 0.2 to the main diagonal of the correlation matrix calculated from the EUR population. The left column of panels, 5 annotations with effect size log5; the right column of panels, 40 annotations with effect size log1.5. The bins and calculation of C.I.s are the same as in Figure 4.
Figure 10
Figure 10
P-values, PIPs, annotations, and the LD for cis-eQTL analysis of SFXN2. The green lines are PIPs. The LD between the peak SNP and the remaining SNPs are color coded in the top panel. The three middle panels illustrated the annotations for individual SNPs. The bottom diagonal matrix shows the LD pattern among all SNPs in this locus.

References

    1. Abecasis G. R., Auton A., Brooks L. D., DePristo M. A., Durbin R. M., et al. , 2012. An integrated map of genetic variation from 1,092 human genomes. Nature 491: 56–65. - PMC - PubMed
    1. Benner C., Spencer C. C., Havulinna A. S., Salomaa V., Ripatti S., et al. , 2016. FINEMAP: efficient variable selection using summary data from genome-wide association studies. Bioinformatics 32: 1493–1501. - PMC - PubMed
    1. Bert S. A., Robinson M. D., Strbenac D., Statham A. L., Song J. Z., et al. , 2013. Regional activation of the cancer genome by long-range epigenetic remodeling. Cancer Cell 23: 9–22. - PubMed
    1. Bishop C. M., 2006. Pattern Recognition and Machine Learning. Springer, New York.
    1. Carbonetto P., Stephens M., 2013. Integrated enrichment analysis of variants and pathways in genome-wide association studies indicates central role for IL-2 signaling genes in type 1 diabetes, and cytokine signaling genes in Crohn’s disease. PLoS Genet. 9: e1003770. - PMC - PubMed

Publication types

LinkOut - more resources