

Estimating species diversity and distribution in the era of Big Data: to what extent can we trust public databases?
- PMID: 27656106
- PMCID: PMC5012125
- DOI: 10.1111/geb.12326
Estimating species diversity and distribution in the era of Big Data: to what extent can we trust public databases?
Abstract
Aim: Massive digitalization of natural history collections is now leading to a steep accumulation of publicly available species distribution data. However, taxonomic errors and geographical uncertainty of species occurrence records are now acknowledged by the scientific community - putting into question to what extent such data can be used to unveil correct patterns of biodiversity and distribution. We explore this question through quantitative and qualitative analyses of uncleaned versus manually verified datasets of species distribution records across different spatial scales.
Location: The American tropics.
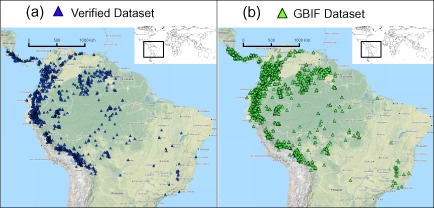
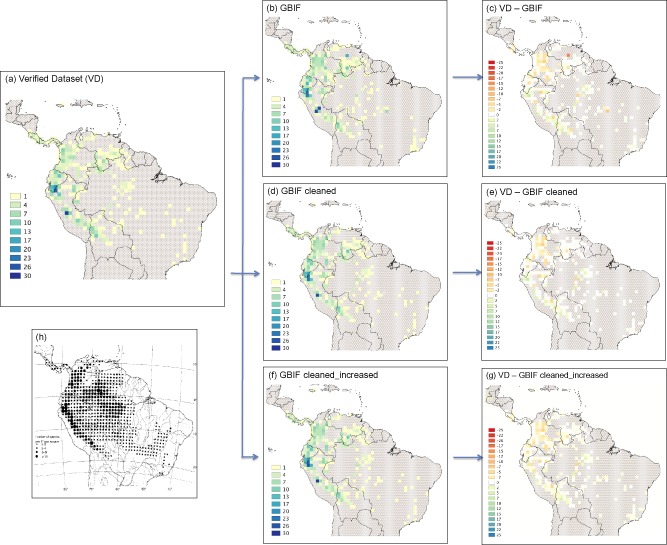
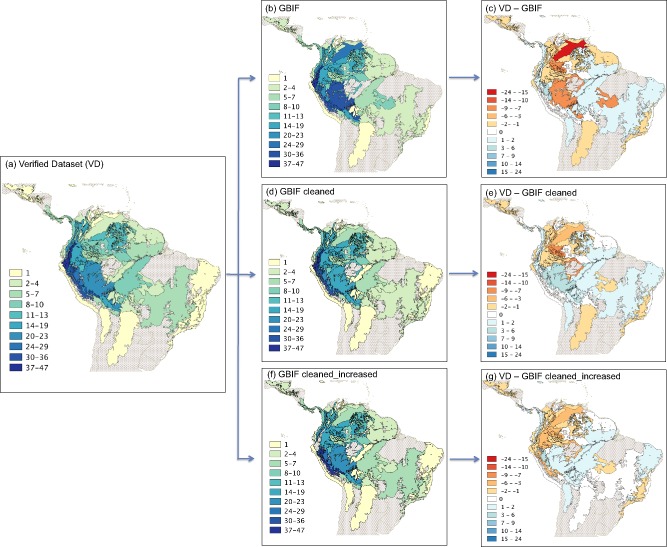
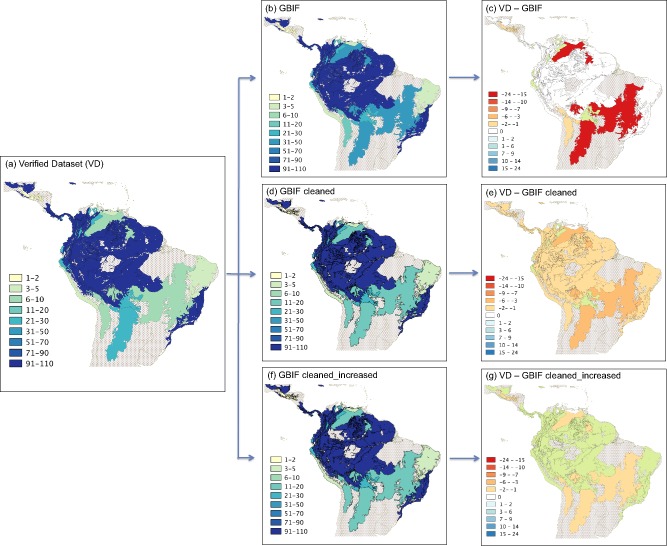
Methods: As test case we used the plant tribe Cinchoneae (Rubiaceae). We compiled four datasets of species occurrences: one created manually and verified through classical taxonomic work, and the rest derived from GBIF under different cleaning and filling schemes. We used new bioinformatic tools to code species into grids, ecoregions, and biomes following WWF's classification. We analysed species richness and altitudinal ranges of the species.
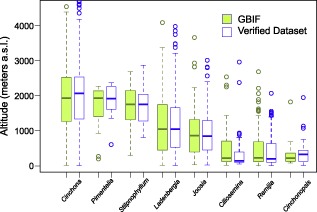
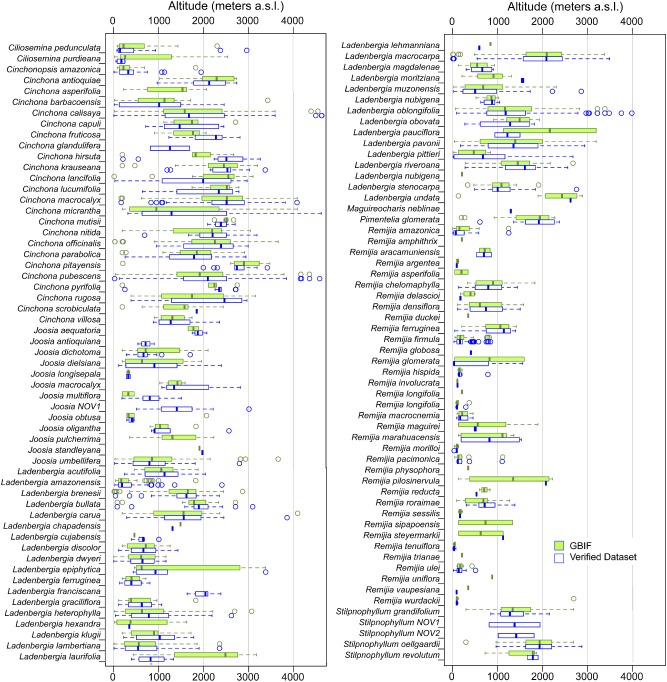
Results: Altitudinal ranges for species and genera were correctly inferred even without manual data cleaning and filling. However, erroneous records affected spatial patterns of species richness. They led to an overestimation of species richness in certain areas outside the centres of diversity in the clade. The location of many of these areas comprised the geographical midpoint of countries and political subdivisions, assigned long after the specimens had been collected.
Main conclusion: Open databases and integrative bioinformatic tools allow a rapid approximation of large-scale patterns of biodiversity across space and altitudinal ranges. We found that geographic inaccuracy affects diversity patterns more than taxonomic uncertainties, often leading to false positives, i.e. overestimating species richness in relatively species poor regions. Public databases for species distribution are valuable and should be more explored, but under scrutiny and validation by taxonomic experts. We suggest that database managers implement easy ways of community feedback on data quality.
Keywords: Cinchoneae; GBIF; Rubiaceae; SpeciesGeoCoder; data quality; occurrence data; species richness.
Figures
References
-
- Andersson, L. (1995) Tribes and genera of the Cinchoneae complex (Rubiaceae). Annals of the Missouri Botanical Garden, 82, 409–427.
-
- Andersson, L. & Antonelli, A. (2005) Phylogeny of the tribe Cinchoneae (Rubiaceae), its position in Cinchonoideae, and description of a new genus, Ciliosemina. Taxon, 54, 17–28.
-
- Beck, J. , Ballesteros‐Mejia, L. , Buchmann, C.M. , Dengler, J. , Fritz, S.A. , Gruber, B. , Hof, C. , Jansen, F. , Knapp, S. & Kreft, H. (2012) What's on the horizon for macroecology? Ecography, 35, 673–683.
-
- Beck, J. , Böller, M. , Erhardt, A. & Schwanghart, W. (2014) Spatial bias in the GBIF database and its effect on modeling species' geographic distributions. Ecological Informatics, 19, 10–15.
LinkOut - more resources
Full Text Sources
Other Literature Sources
Research Materials