. 2016:2016:4705162.
doi: 10.1155/2016/4705162. Epub 2016 Sep 5.

Select and Cluster: A Method for Finding Functional Networks of Clustered Voxels in fMRI

Affiliations

Select and Cluster: A Method for Finding Functional Networks of Clustered Voxels in fMRI

Danilo DonGiovanni et al. Comput Intell Neurosci. 2016.

Abstract

Extracting functional connectivity patterns among cortical regions in fMRI datasets is a challenge stimulating the development of effective data-driven or model based techniques. Here, we present a novel data-driven method for the extraction of significantly connected functional ROIs directly from the preprocessed fMRI data without relying on a priori knowledge of the expected activations. This method finds spatially compact groups of voxels which show a homogeneous pattern of significant connectivity with other regions in the brain. The method, called Select and Cluster (S&C), consists of two steps: first, a dimensionality reduction step based on a blind multiresolution pairwise correlation by which the subset of all cortical voxels with significant mutual correlation is selected and the second step in which the selected voxels are grouped into spatially compact and functionally homogeneous ROIs by means of a Support Vector Clustering (SVC) algorithm. The S&C method is described in detail. Its performance assessed on simulated and experimental fMRI data is compared to other methods commonly used in functional connectivity analyses, such as Independent Component Analysis (ICA) or clustering. S&C method simplifies the extraction of functional networks in fMRI by identifying automatically spatially compact groups of voxels (ROIs) involved in whole brain scale activation networks.


Figures

Figure 1
Figure 1
Schematic representation of the multiscale correlation analysis algorithm aimed at selecting those Grey Matter voxels showing significant connectivity to be used for further analysis.
Figure 2
Figure 2
2D visualization of the 3D multiscale correlation analysis procedure implemented. (a) Coarse voxels time series are derived from fine scale cortical voxels and an all to all correlation analysis is performed; (b) the downsampling coarse grid is shifted and the correlation analysis is repeated on the corresponding new set of coarse voxels time series; (c) a Binary Mask is derived from the union of all coarse voxels (blue squares from first correlation analysis and red squares after the grid shift) involved in at least one significant connection in one of the two coarse level correlation analyses. (d) Fine scale correlation analysis performed on the set of voxels in the output from the coarse scale correlation analysis. (e) A fine scale binary mask derived from the union of all cortical voxels involved in at least one significant connection at the fine scale (in black are the voxels eliminated from the correlation).
Figure 3
Figure 3
Graphical representation of Support Vector Clustering working principle: Support Vectors, marked with circles, define the boundaries of clusters in the input space (a) and lie on the surface of the minimal enclosing hyper sphere in the mapped space (b), while all other nonsupport vector input points will lie within the hyper sphere in the mapped space. Φ is the mapping function across input (a) and mapped space (b). A path connecting two input points belonging to the same cluster has been sampled in pink in the input space: points on this path will be mapped inside the hypersphere on the right. A path connecting two input vectors belonging to two different clusters has been sampled in green in the input space: points on this path will be mapped outside the hypersphere on the right.
Figure 4
Figure 4
FM index relative to the compatibility test between the activation ROIs partition and the partition induced by the spatiofunctional SVC. Voxels used in the computation are those ROIs voxels resulting in significant connectivity as assessed by the multiscale correlation analysis (MSCA).
Figure 5
Figure 5
Predefined ROIs voxels showing connectivity are presented for three sample subjects in task MDT, MDTPM, and MDT, respectively (a, c, and e). Clusters induced by the spatiofunctional SVC clustering with maximal intersection with predefined ROIs are presented for three sample subjects MDT, MDTPM, and MDT, respectively (b, d, and f). Arbitrary colors are used to distinguish identified ROIs.
Figure 6
Figure 6
Comparison of ROIs clusters found by S&C method (a) and ICA method (b) for one sample subject in task MTLOC. (a) To generate the presented connectivity network map from our method's output we postprocessed the set of clusters in output by the SVC performing a pairwise correlation analysis on their associated mean time series. Then we extracted from the correlation matrix the largest set of all mutually significantly correlated ROIs including area MT in the considered subject. The resulting set of mutually connected ROIs was then visualized on the subject structural volume. To help visualization and comparison with ICA maps, all ROIs in the network are reported in same colour. (b) The first two stimulus related independent components, with Pearson Correlation coefficient with HRF of R = .42 and R = .31, are reported in blue and red colour, respectively. The independent components were z-transformed and a threshold of z ≥ 2 was applied.
Figure 7
Figure 7
t-transformed correlation coefficient distributions at coarse and fine scale for a sample seed voxel in a sample subject before and after applying the correction. Coarse level t-transformed cross-correlation distribution (a) before applying normality correction and (b) after applying it. Fine scale t-transformed cross-correlation coefficient distribution (c) before applying normality correction and (d) after applying it.
Figure 8
Figure 8
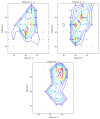
In the figure in Talairach X, Y, and Z coordinates, the spatial gradient of the number of pairwise connections to all other cortical voxels is reported, projected by voxels within a cubic volume centered in area MT right hemisphere for a sample subject in task MTLOC. The number of connections formed increases as reaching the center of MT area.
Figure 9
Figure 9
Percentage of voxels recovered after applying the coarse grid shift procedure to the total number of voxels in the ROI. Data from all subjects in all tasks were used to build the histogram. For some ROIs almost all voxels (98%) are recovered after the shift.

References

    1. Rogers B. P., Morgan V. L., Newton A. T., Gore J. C. Assessing functional connectivity in the human brain by fMRI. Magnetic Resonance Imaging. 2007;25(10):1347–1357. doi: 10.1016/j.mri.2007.03.007. - DOI - PMC - PubMed
    1. Li K., Guo L., Nie J., Li G., Liu T. Review of methods for functional brain connectivity detection using fMRI. Computerized Medical Imaging and Graphics. 2009;33(2):131–139. doi: 10.1016/j.compmedimag.2008.10.011. - DOI - PMC - PubMed
    1. Cordes D., Haughton V. M., Arfanakis K., et al. Frequencies contributing to functional connectivity in the cerebral cortex in ‘resting-state’ data. American Journal of Neuroradiology. 2001;22(7):1326–1333. - PMC - PubMed
    1. Bokde A. L. W., Tagamets M.-A., Friedman R. B., Horwitz B. Functional interactions of the inferior frontal cortex during the processing of words and word-like stimuli. Neuron. 2001;30(2):609–617. doi: 10.1016/S0896-6273(01)00288-4. - DOI - PubMed
    1. Achard S., Bullmore E. Efficiency and cost of economical brain functional networks. PLoS Computational Biology. 2007;3(2, article e17) doi: 10.1371/journal.pcbi.0030017. - DOI - PMC - PubMed