. 2016:2016:4921067.
doi: 10.1155/2016/4921067. Epub 2016 Aug 30.

The Induction of Apoptosis in A375 Malignant Melanoma Cells by Sutherlandia frutescens

Affiliations

The Induction of Apoptosis in A375 Malignant Melanoma Cells by Sutherlandia frutescens

Nicola B van der Walt et al. Evid Based Complement Alternat Med. 2016.

Abstract

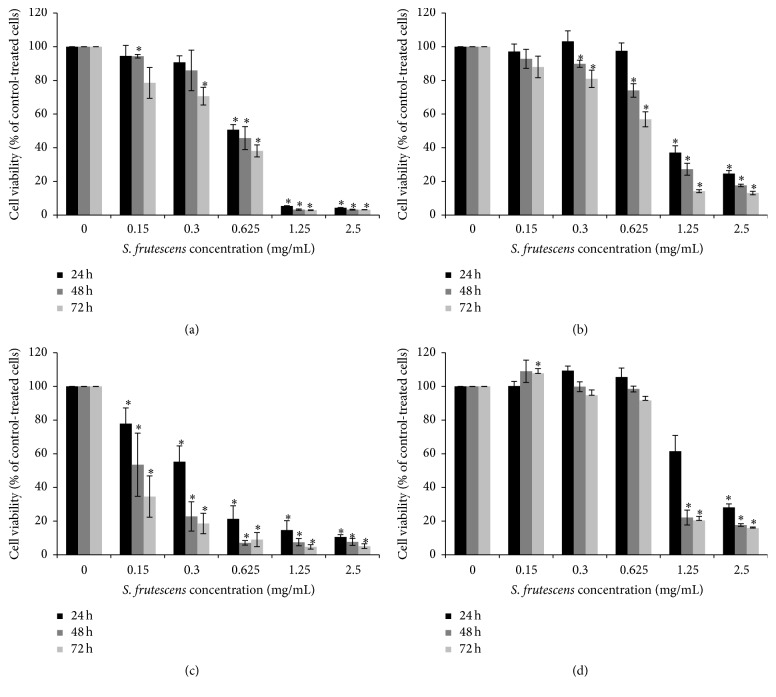
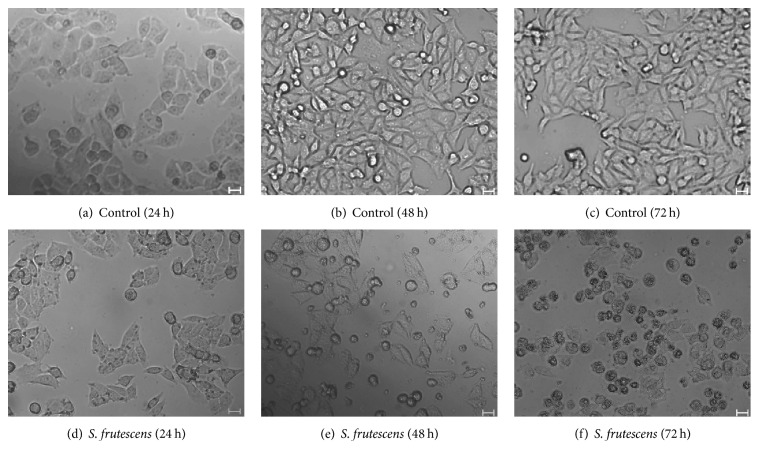
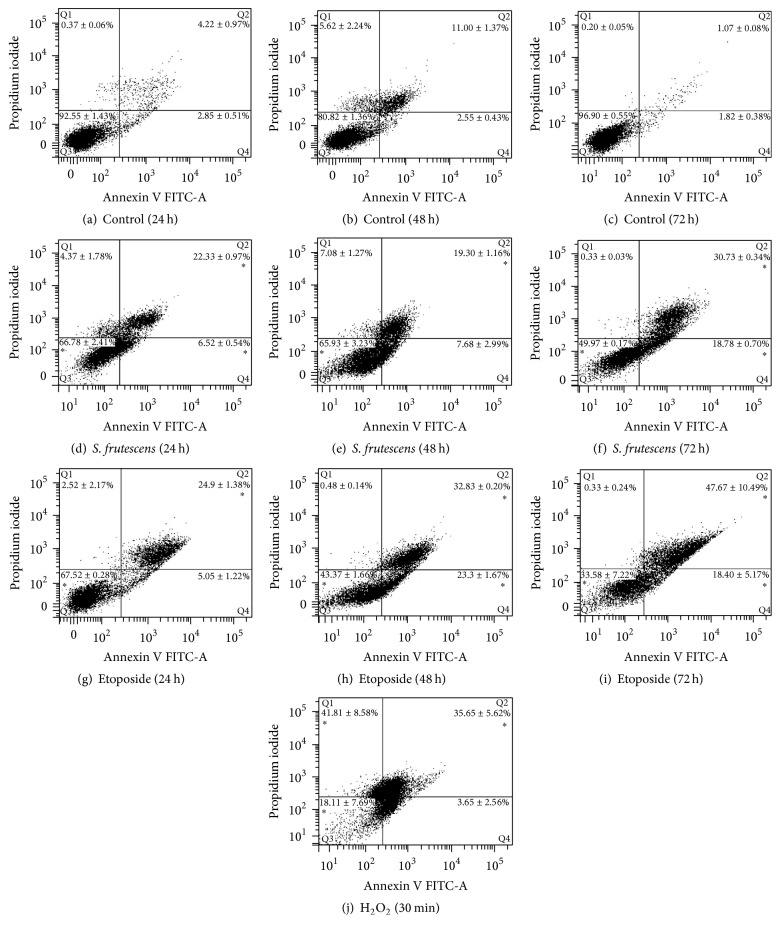
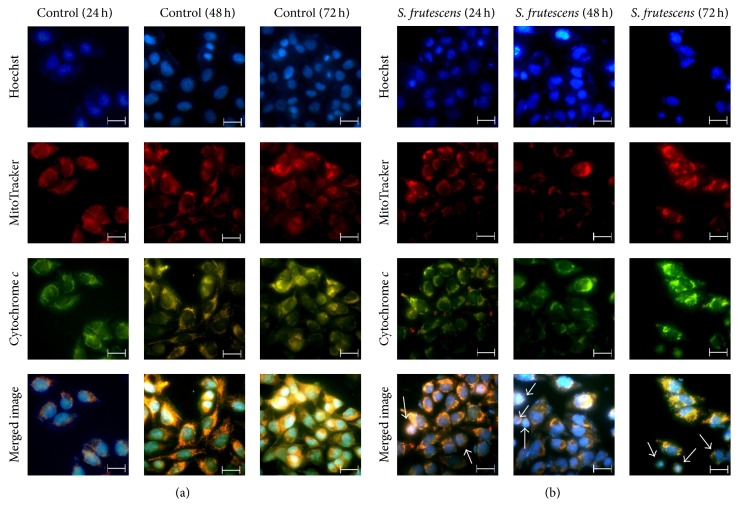
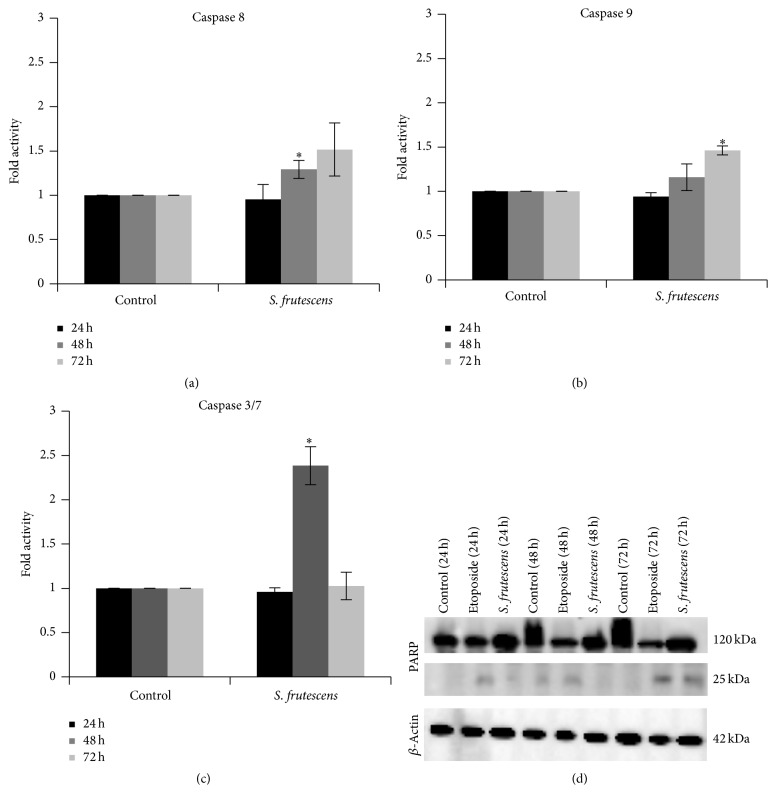
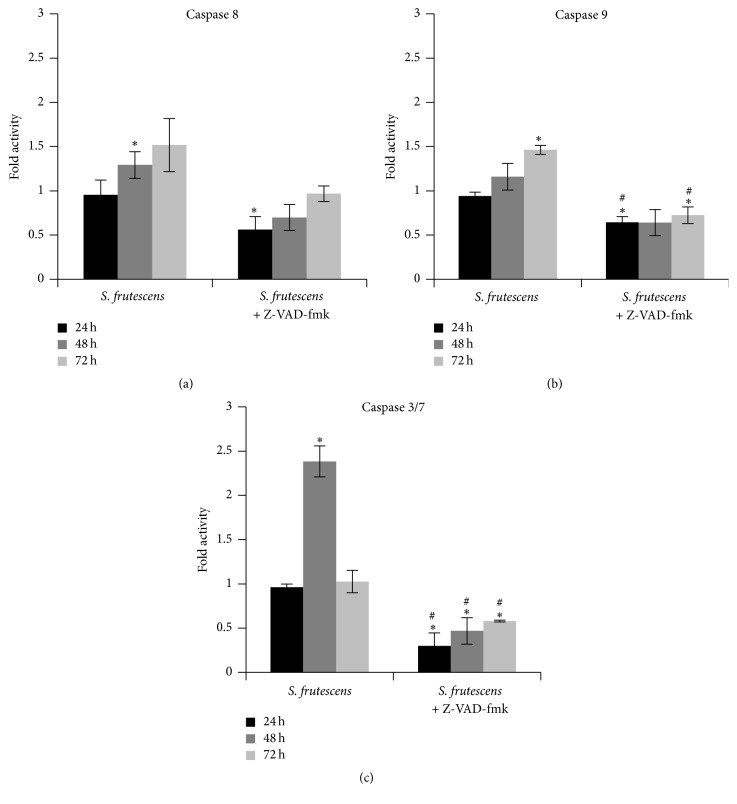
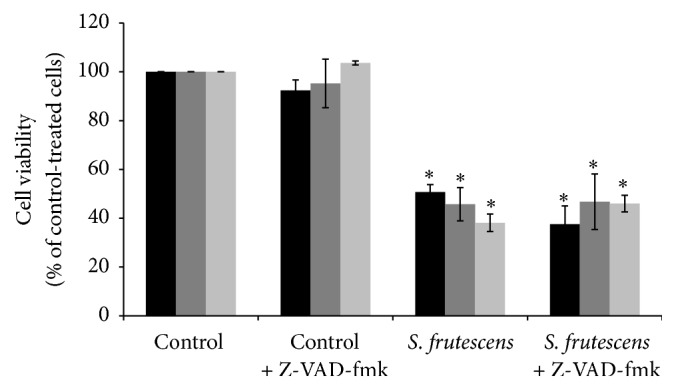
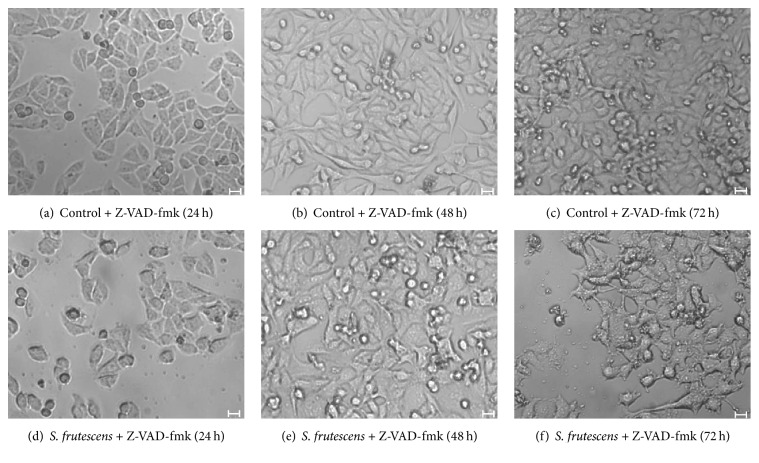
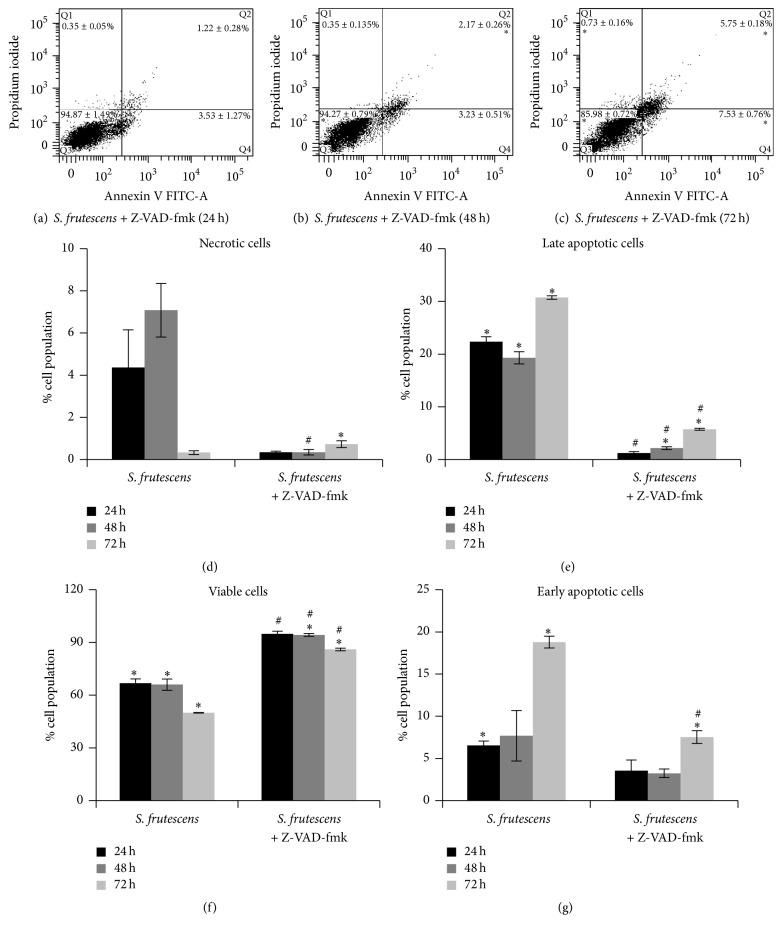
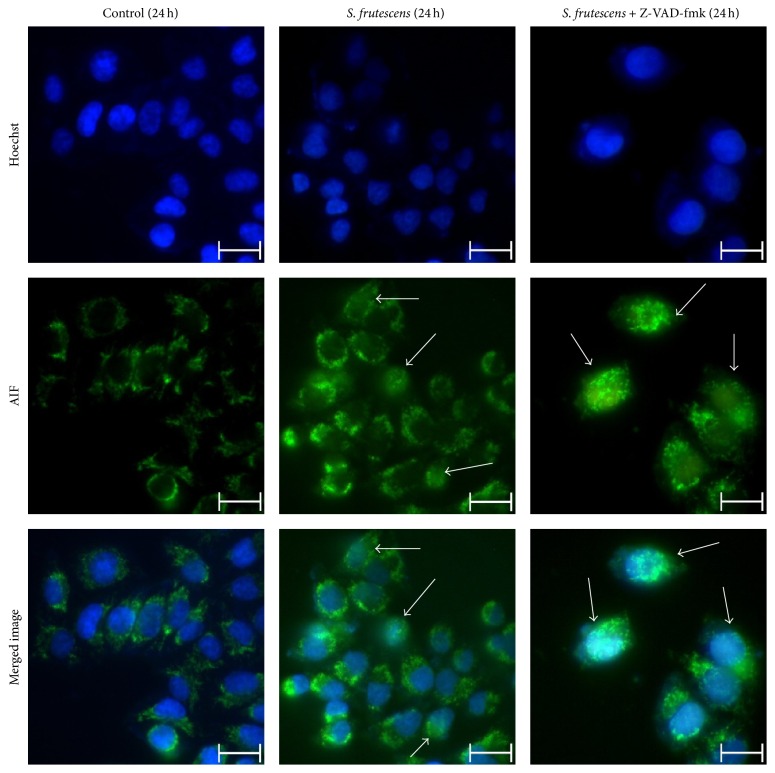
Sutherlandia frutescens is a medicinal plant indigenous to Southern Africa and is commonly known as the "cancer bush." This plant has traditionally been used for the treatment of various ailments, although it is best known for its claims of activity against "internal" cancers. Here we report on its effect on melanoma cells. The aim of this study was to investigate whether an extract of S. frutescens could induce apoptosis in the A375 melanoma cell line and to outline the basic mechanism of action. S. frutescens extract induced apoptosis in A375 cells as evidenced by morphological features of apoptosis, phosphatidylserine exposure, nuclear condensation, caspase activation, and the release of cytochrome c from the mitochondria. Studies in the presence of a pan-caspase inhibitor allude to caspase-independent cell death, which appeared to be mediated by the apoptosis inducing factor. Taken together, the results of this study show that S. frutescens extract is effective in inducing apoptosis in malignant melanoma cells and indicates that further in vivo mechanistic studies may be warranted.


Figures

Figure 1
Figure 1
The effect of S. frutescens extract on the viability of (a) A375 melanoma, (b) Colo-800 melanoma, (c) HDFα fibroblast, and (d) Hek 293 cells after 24, 48, and 72 h of treatment. The viability was assessed using the alamarBlue assay and expressed as percentage relative to the control-treated cells (0 mg/mL). Error bars represent the SEM (n ≥ 3) and indicates a significant difference from 0 mg/mL (P < 0.05).
Figure 2
Figure 2
The effect of S. frutescens on the morphology of A375 cells. Control-treated cells (a)–(c) are typical, healthy A375 cells which become more confluent with an increase in treatment time. S. frutescens extract causes morphological changes in the A375 cells (d)–(f). These include the loss of adherence and cell shrinkage. The scale bar represents 20 μm.
Figure 3
Figure 3
S. frutescens extract induces apoptosis in A375 cells. Representative scatterplots of annexin V-FITC and PI for control-treated cells (a)–(c), cells treated with S. frutescens (d)–(f), cells treated with etoposide, and a known inducer of apoptosis (g)–(i) for 24, 48, and 72 h as well as cells treated with hydrogen peroxide for 30 min, which served as a necrotic control (j). The percentage of the cell population ± the SEM (n = 3) that is in Q1 (necrotic), Q2 (late apoptotic), Q3 (viable), or Q4 (early apoptotic) is shown. A significant difference compared to the control-treated cells is indicated by (P < 0.05).
Figure 4
Figure 4
Cytochrome c is released into the cytoplasm in response to S. frutescens treatment. Control and S. frutescens-treated cells were stained with Hoechst 33258, which binds to DNA, MitoTracker orange, which accumulates in active mitochondria, and Alexa-488-tagged anti-cytochrome c antibody, which labels cytochrome c. (a) The control-treated cells have intact mitochondrial membrane potential and cytochrome c which is localized in the mitochondria. (b) In the S. frutescens-treated cells, the cytochrome c staining appeared more diffuse and less intense yellow staining was observed in the merged image as indicated by white arrows. This is due to a reduced overlap of cytochrome c and MitoTracker orange and indicates the release of cytochrome c from the mitochondria. The scale bar represents 20 μm.
Figure 5
Figure 5
S. frutescens extract causes caspase activation. The activity of (a) caspase 8, (b) caspase 9, and (c) caspase 3/7 in control- and S. frutescens-treated A375 cells was measured using the Caspase-Glo assays 24, 48, and 72 h after treatment. The activity of the caspases in the S. frutescens-treated cells is shown as a fold increase relative to the control-treated cells. Error bars represent the SEM (n = 3) and indicates a significant difference compared to the control-treated cells (P < 0.05). (d) Cleaved PARP was detected by western blot and confirmed the activity of the executioner caspases in response to S. frutescens treatment. Etoposide treatment served as a positive apoptotic control and β-actin served as a loading control.
Figure 6
Figure 6
Z-VAD-fmk prevents caspase activation in response to S. frutescens extract. The activity of (a) caspase8, (b) caspase 9, and (c) caspase 3/7 was measured in cells treated with S. frutescens extract in the absence and presence of Z-VAD-fmk for 24 h, 48 h, and 72 h and expressed as a fold increase relative to the control cells. Error bars represent the SEM (n = 3), indicates a significant difference from the control-treated cells (P < 0.05), and # indicates a significant difference from the cells treated with S. frutescens alone.
Figure 7
Figure 7
Z-VAD-fmk did not prevent the reduction of cell viability in response to S. frutescens extract. Cell viability was assessed using the alamarBlue assay and expressed as percentage relative to the control-treated cells. Error bars represent the SEM (n = 3) and indicates a significant difference from the control-treated cells (P < 0.05). No statistical differences were observed in the viability of the cells treated with S. frutescens in the presence or absence of Z-VAD-fmk.
Figure 8
Figure 8
Morphology of A375 cells, pretreated with Z-VAD-fmk, in response to control or S. frutescens treatment after 24, 48, or 72 h. The pretreatment with Z-VAD-fmk did not alter the morphology of the control-treated cells (a)–(c) indicating that it is not cytotoxic. Z-VAD-fmk did not prevent cell detachment in response to S. frutescens extract (d)–(f). Scale bar represents 20 μm.
Figure 9
Figure 9
Z-VAD-fmk prevents the externalization of PS following S. frutescens treatment. Representative scatterplots of FITC-labelled annexin V and PI for cells pretreated with 20 μM Z-VAD-fmk followed by treatment with S. frutescens for (a) 24 h, (b) 48 h, and (c) 72 h. The percentage of the cell population ± the SEM (n = 3) that is in Q1 (necrotic), Q2 (late apoptotic), Q3 (viable), or Q4 (early apoptotic) is shown on the scatterplots. A comparison between the percentages of the cell population ± the SEM (n = 3) that is (d) necrotic, (e) late apoptotic, (f) viable, or (g) early apoptotic in cells treated with S. frutescens in the absence or presence of Z-VAD-fmk; indicates a significant difference compared to the control-treated cells; # indicates a significant difference compared to the cells treated with S. frutescens alone (P < 0.05).
Figure 10
Figure 10
AIF translocates to the nucleus in response to S. frutescens extract. AIF is localized in the mitochondria of control-treated cells. S. frutescens treatment induces the nuclear translocation of AIF, as indicated by white arrows. Z-VAD-fmk does not prevent the nuclear translocation of AIF in response to S. frutescens. Cells were stained with Hoechst 33258 to label the nuclei and Alexa-tagged anti-AIF antibody to determine the subcellular localization of AIF. The white arrows indicate the nuclear localization of AIF. The scale bar represents 20 μm.

References

    1. Jemal A., Bray F., Center M. M., Ferlay J., Ward E., Forman D. Global cancer statistics. CA—A Cancer Journal for Clinicians. 2011;61(2):69–90. doi: 10.3322/caac.20107. - DOI - PubMed
    1. Ferlay J., Shin H.-R., Bray F., Forman D., Mathers C., Parkin D. M. Estimates of worldwide burden of cancer in 2008: GLOBOCAN 2008. International Journal of Cancer. 2010;127(12):2893–2917. doi: 10.1002/ijc.25516. - DOI - PubMed
    1. Herbst M. C. Cancer Association of South Africa (CANSA) fact sheet on the top ten cancers per population. 2015, http://www.cansa.org.za/files/2015/05/Fact-Sheet-Top-Ten-Cancers-per-Pop....
    1. Tan G., Gyllenhaal C., Soejarto D. D. Biodiversity as a source of anticancer drugs. Current Drug Targets. 2006;7(3):265–277. doi: 10.2174/138945006776054942. - DOI - PubMed
    1. van Wyk B.-E., Albrecht C. A review of the taxonomy, ethnobotany, chemistry and pharmacology of Sutherlandia frutescens (Fabaceae) Journal of Ethnopharmacology. 2008;119(3):620–629. doi: 10.1016/j.jep.2008.08.003. - DOI - PubMed

LinkOut - more resources