

Selenotranscriptomic Analyses Identify Signature Selenoproteins in Brain Regions in a Mouse Model of Parkinson's Disease
- PMID: 27656880
- PMCID: PMC5033372
- DOI: 10.1371/journal.pone.0163372
Selenotranscriptomic Analyses Identify Signature Selenoproteins in Brain Regions in a Mouse Model of Parkinson's Disease
Abstract
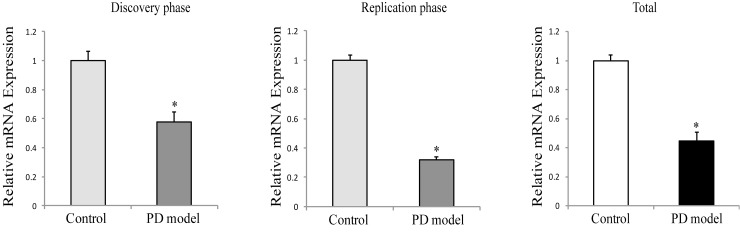
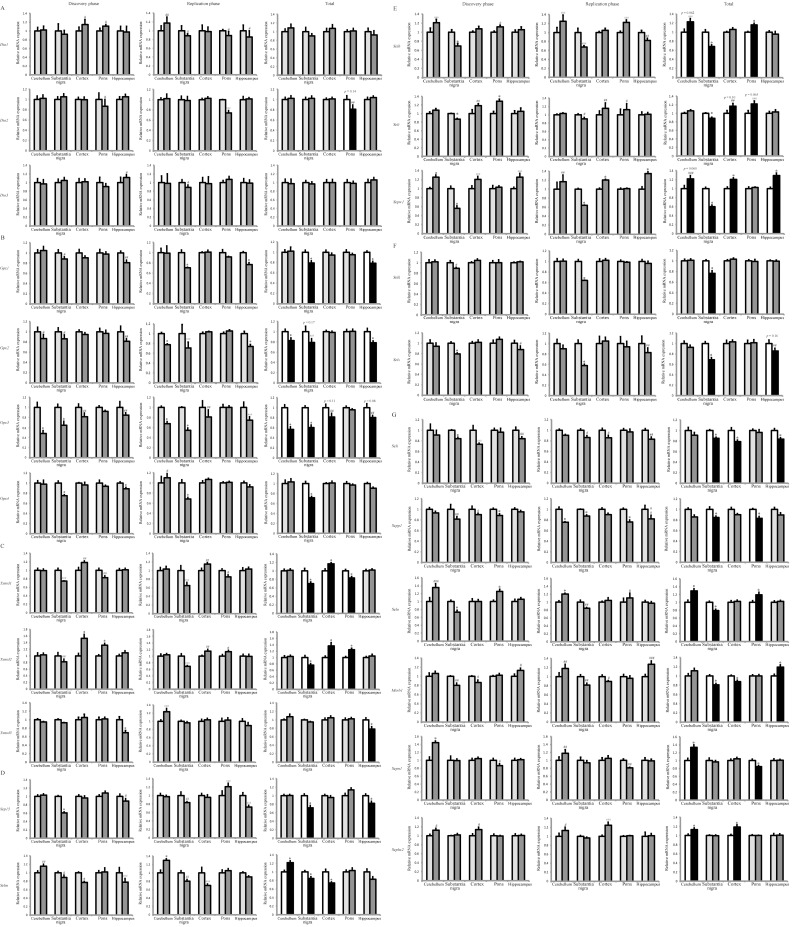
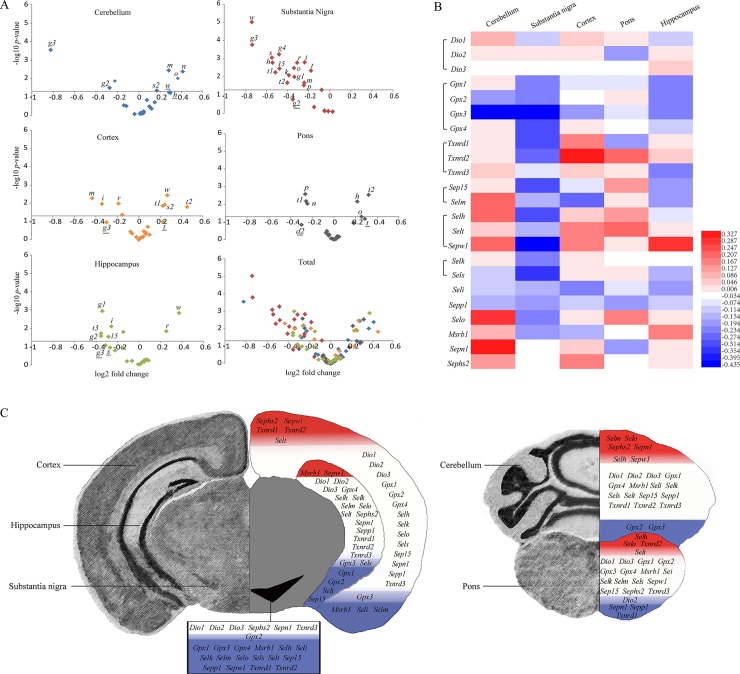
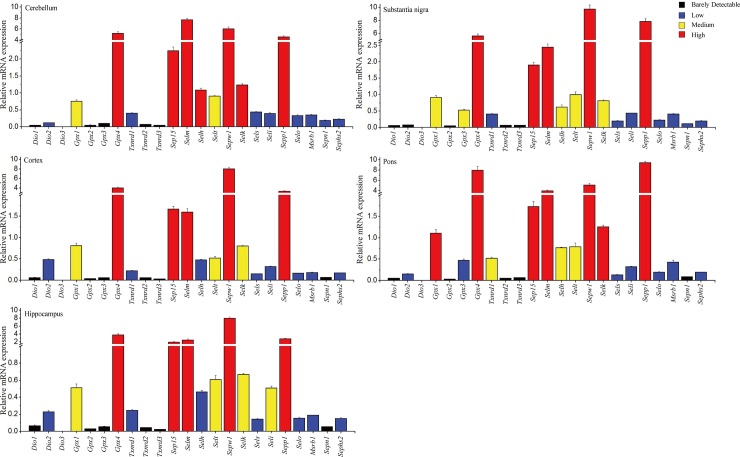
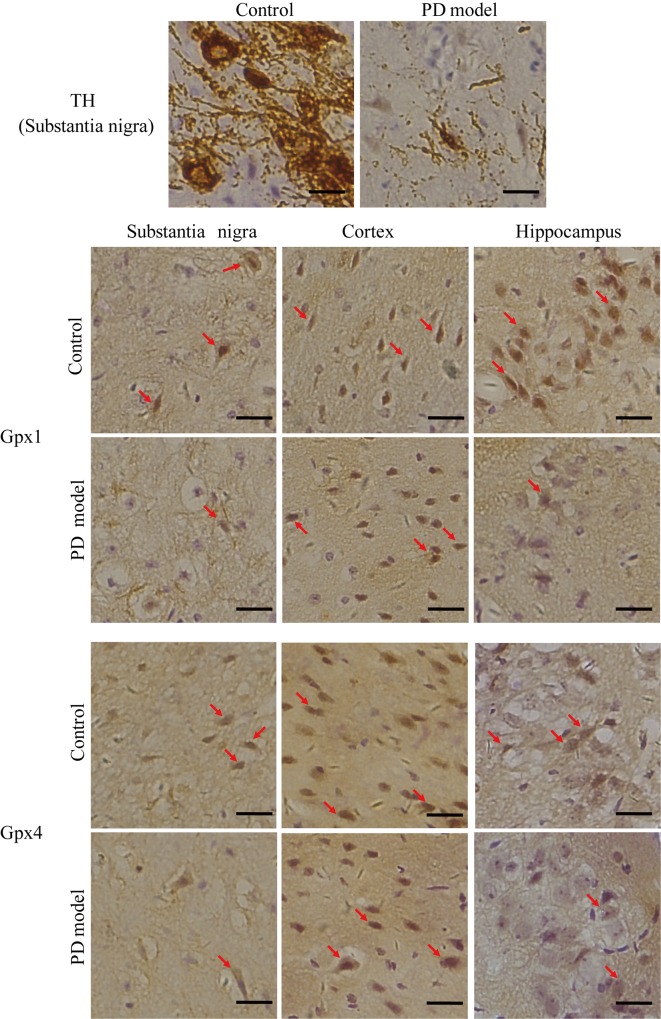
Genes of selenoproteome have been increasingly implicated in various aspects of neurobiology and neurological disorders, but remain largely elusive in Parkinson's disease (PD). In this study, we investigated the selenotranscriptome (24 selenoproteins in total) in five brain regions (cerebellum, substantia nigra, cortex, pons and hippocampus) by real time qPCR in a two-phase manner using a mouse model of chronic PD. A wide range of changes in selenotranscriptome was observed in a manner depending on selenoproteins and brain regions. While Selv mRNA was not detectable and Dio1& 3 mRNA levels were not affected, 1, 11 and 9 selenoproteins displayed patterns of increase only, decrease only, and mixed response, respectively, in these brain regions of PD mice. In particular, the mRNA expression of Gpx1-4 showed only a decreased trend in the PD mouse brains. In substantia nigra, levels of 17 selenoprotein mRNAs were significantly decreased whereas no selenoprotein was up-regulated in the PD mice. In contrast, the majority of selenotranscriptome did not change and a few selenoprotein mRNAs that respond displayed a mixed pattern of up- and down-regulation in cerebellum, cortex, hippocampus, and/or pons of the PD mice. Gpx4, Sep15, Selm, Sepw1, and Sepp1 mRNAs were most abundant across all these five brain regions. Our results showed differential responses of selenoproteins in various brain regions of the PD mouse model, providing critical selenotranscriptomic profiling for future functional investigation of individual selenoprotein in PD etiology.
Conflict of interest statement
The authors have declared that no competing interests exist.
Figures
Similar articles
-
Gene expression of selenoproteins can be regulated by selenoprotein K silencing in chicken myoblasts.Biometals. 2016 Aug;29(4):679-89. doi: 10.1007/s10534-016-9943-3. Epub 2016 Jun 25. Biometals. 2016. PMID: 27344320
-
Comparative analysis of selenocysteine machinery and selenoproteome gene expression in mouse brain identifies neurons as key functional sites of selenium in mammals.J Biol Chem. 2008 Jan 25;283(4):2427-38. doi: 10.1074/jbc.M707951200. Epub 2007 Nov 21. J Biol Chem. 2008. PMID: 18032379
-
Evaluation of the selenotranscriptome expression in two hepatocellular carcinoma cell lines.Anal Cell Pathol (Amst). 2015;2015:419561. doi: 10.1155/2015/419561. Epub 2015 Jun 23. Anal Cell Pathol (Amst). 2015. PMID: 26199857 Free PMC article.
-
Selenium and selenoprotein function in brain disorders.IUBMB Life. 2014 Apr;66(4):229-39. doi: 10.1002/iub.1262. Epub 2014 Mar 25. IUBMB Life. 2014. PMID: 24668686 Review.
-
Adaptive dysfunction of selenoproteins from the perspective of the triage theory: why modest selenium deficiency may increase risk of diseases of aging.FASEB J. 2011 Jun;25(6):1793-814. doi: 10.1096/fj.11-180885. Epub 2011 Mar 14. FASEB J. 2011. PMID: 21402715 Review.
Cited by
-
Selenium Nanoparticles in Protecting the Brain from Stroke: Possible Signaling and Metabolic Mechanisms.Nanomaterials (Basel). 2024 Jan 11;14(2):160. doi: 10.3390/nano14020160. Nanomaterials (Basel). 2024. PMID: 38251125 Free PMC article. Review.
-
Knocking out Selenium Binding Protein 1 Induces Depressive-Like Behavior in Mice.Biol Trace Elem Res. 2024 Jul;202(7):3149-3162. doi: 10.1007/s12011-023-03894-8. Epub 2023 Oct 6. Biol Trace Elem Res. 2024. PMID: 37801218
-
Transcriptional Regulation of Selenoprotein F by Heat Shock Factor 1 during Selenium Supplementation and Stress Response.Cells. 2019 May 18;8(5):479. doi: 10.3390/cells8050479. Cells. 2019. PMID: 31109102 Free PMC article.
-
Selenium Effects on Oxidative Stress-Induced Calcium Signaling Pathways in Parkinson's Disease.Indian J Clin Biochem. 2022 Jul;37(3):257-266. doi: 10.1007/s12291-022-01031-1. Epub 2022 Apr 15. Indian J Clin Biochem. 2022. PMID: 35873611 Free PMC article. Review.
-
Selenium Forms and Dosages Determined Their Biological Actions in Mouse Models of Parkinson's Disease.Nutrients. 2022 Dec 20;15(1):11. doi: 10.3390/nu15010011. Nutrients. 2022. PMID: 36615668 Free PMC article.
References
LinkOut - more resources
Full Text Sources
Other Literature Sources
Miscellaneous
