. 2016 Sep 22;11(9):e0163048.
doi: 10.1371/journal.pone.0163048. eCollection 2016.

A Genome-Wide Association Study of Attention Function in a Population-Based Sample of Children

Affiliations

A Genome-Wide Association Study of Attention Function in a Population-Based Sample of Children

Silvia Alemany et al. PLoS One. .

Abstract

Background: Attention function filters and selects behaviorally relevant information. This capacity is impaired in some psychiatric disorders and has been proposed as an endophenotype for Attention-Deficit/Hyperactivity Disorder; however, its genetic basis remains largely unknown. This study aimed to identify single nucleotide polymorphism (SNPs) associated with attention function.

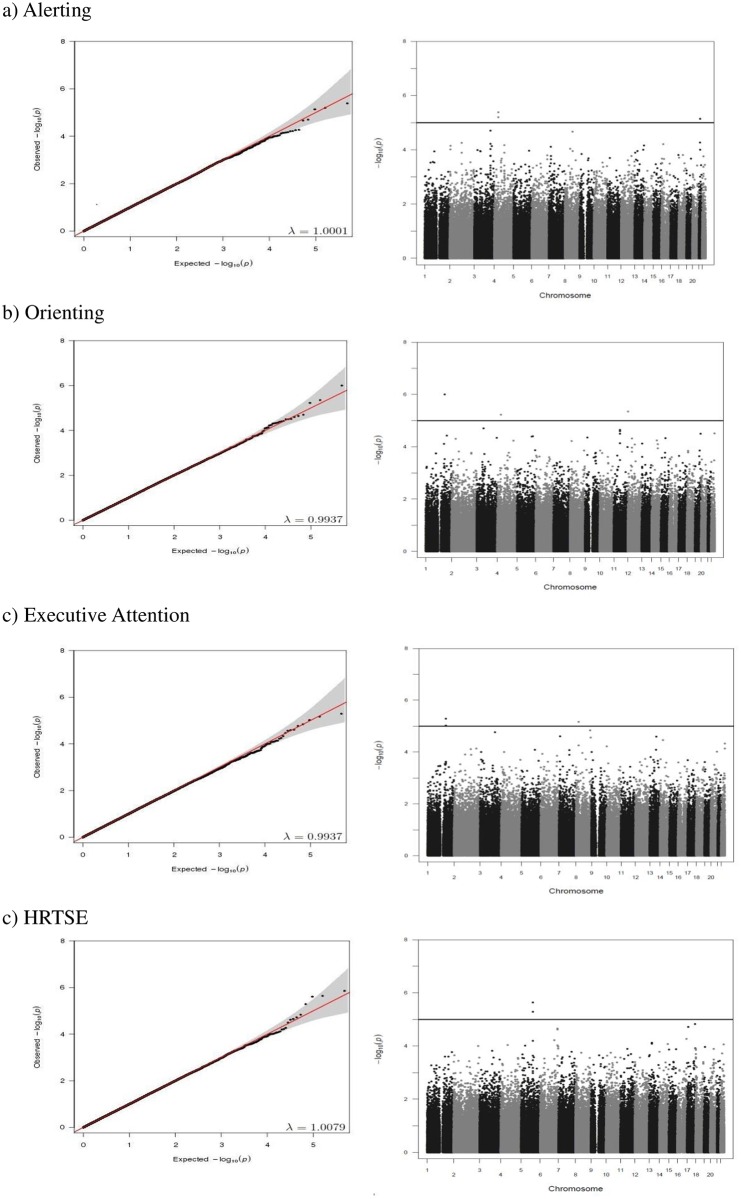
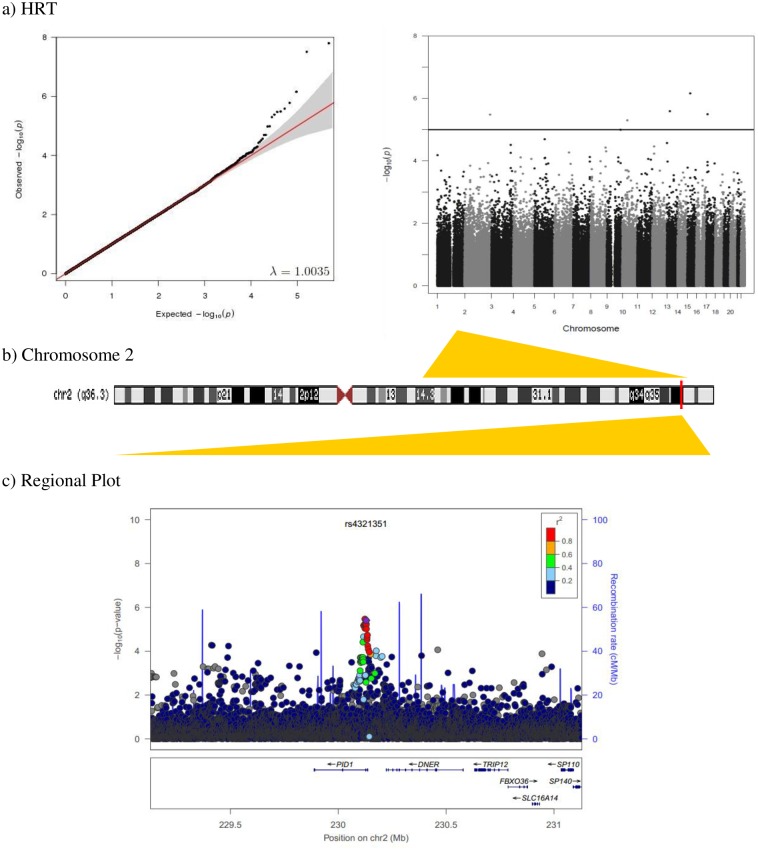
Materials and methods: The discovery sample included 1655 children (7-12 years) and the replication sample included 546 children (5-8 years). Five attention outcomes were assessed using the computerized Attentional Network Test (ANT): alerting, orienting, executive attention, Hit Reaction time (HRT) and the standard error of HRT (HRTSE). A Genome-wide Association Study was conducted for each outcome. Gene set enrichment analyses were performed to detect biological pathways associated with attention outcomes. Additional neuroimaging analyses were conducted to test neural effects of detected SNPs of interest.

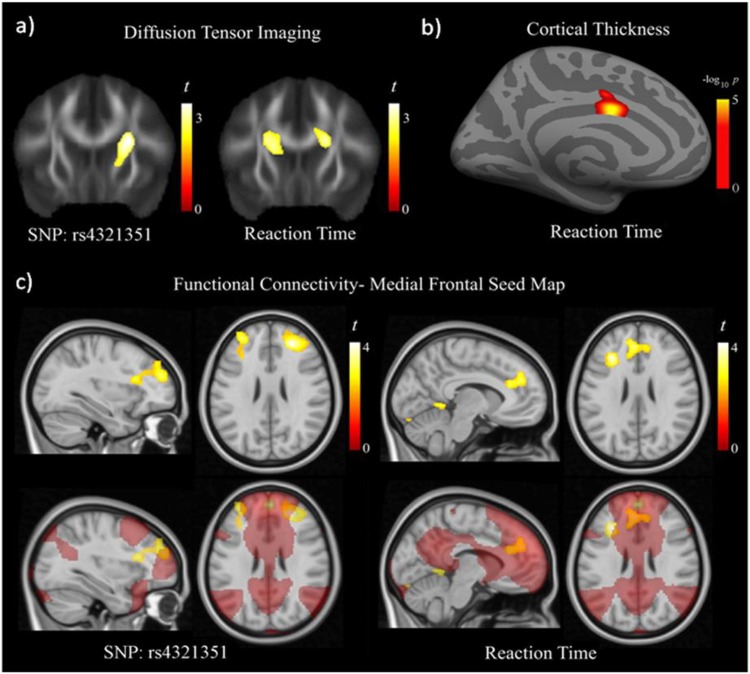
Results: Thirteen loci showed suggestive evidence of association with attention function (P<10-5) in the discovery sample. One of them, the rs4321351 located in the PID1 gene, was nominally significant in the replication sample although it did not survive multiple testing correction. Neuroimaging analysis revealed a significant association between this SNP and brain structure and function involving the frontal-basal ganglia circuits. The mTOR signaling and Alzheimer disease-amyloid secretase pathways were significantly enriched for alerting, orienting and HRT respectively (FDR<5%).

Conclusion: These results suggest for the first time the involvement of the PID1 gene, mTOR signaling and Alzheimer disease-amyloid secretase pathways, in attention function during childhood. These genes and pathways have been proposed to play a role in neuronal plasticity, memory and neurodegenerative disease.


Conflict of interest statement

The authors have declared that no competing interests exist.

Figures

Fig 1
Fig 1. Quantile-quantile (Q-Q) plots (left side) and Manhattan plots (right side) of genome-wide association analyses for (a) alerting, (b) orienting, (c) executive attention, and (d) HRTSE attention outcomes in the discovery sample.
Genomic inflation factor (λ) is included in each Q-Q plot. The blue line in the Manhattan plots indicates the suggestive level of statistical significance (P<10−5).
Fig 2
Fig 2
a) Quantile-quantile and Manhattan plot of genome-wide association results for HRT. The blue line indicates the suggestive level of statistical significance (p<10−5). b) Diagram of the chromosome 2. The red line indicates the position of the rs4321351 (230,129,493 bp). c) Regional association plot of rs4321351 located in PID1 gene. The linkage disequilibrium (LD; r2) between the SNP in focus and its SNPs genotyped or imputed within 1Mb is showed in red (high LD) to blue (low LD). The recombination rate is plotted in blue according to HapMap (CEU).
Fig 3
Fig 3. Diffusion tensor imaging results showed significantly lower fractional anisotropy (FA) in the region of the basal ganglia as a function of the G allele copies of the rs4321351 (a, left image).
Lower HRT scores correlated with lower FA in this region bilaterally (a, right image) and with thinner anterior cingulate cortex (b) (cortical area of 1.2 cm2 centered at MNI, x = -6 y = 2 z = 32, Pcorrected <0.05). Functional connectivity results from the medial frontal seed map (c) showing prefrontal regions with significantly higher functional connectivity as a function of the G allele copies of the rs4321351. Lower HRT scores correlated with higher functional connectivity also in the prefrontal cortex, and in the anterior cingulate cortex. T denotes statistics t value.–log10 p denotes log of the probability p value. The right side corresponds to the right hemisphere in coronal and axial images.

References

    1. Bellgrove MA, Mattingley JB. Molecular genetics of attention. Ann N Y Acad Sci. 2008;1129:200–12. 10.1196/annals.1417.013 - DOI - PubMed
    1. Fan J, Gu X, Guise KG, Liu X, Fossella J, Wang H, et al. Testing the behavioral interaction and integration of attentional networks. Brain Cogn. 2009;70(2):209–20. 10.1016/j.bandc.2009.02.002 - DOI - PMC - PubMed
    1. Posner MI, Rothbart MK. Toward a physical basis of attention and self regulation. Phys Life Rev. 2009;6(2):103–20. Epub 2010/02/18. 10.1016/j.plrev.2009.02.001 - DOI - PMC - PubMed
    1. Anderson P. Assessment and development of executive function (EF) during childhood. Child Neuropsychol. 2002;8(2):71–82. . - PubMed
    1. Egeland J. Differentiating attention deficit in adult ADHD and schizophrenia. Arch Clin Neuropsychol. 2007;22(6):763–71. . - PubMed