

The Lipopolysaccharide-Induced Metabolome Signature in Arabidopsis thaliana Reveals Dynamic Reprogramming of Phytoalexin and Phytoanticipin Pathways
- PMID: 27656890
- PMCID: PMC5033345
- DOI: 10.1371/journal.pone.0163572
The Lipopolysaccharide-Induced Metabolome Signature in Arabidopsis thaliana Reveals Dynamic Reprogramming of Phytoalexin and Phytoanticipin Pathways
Abstract
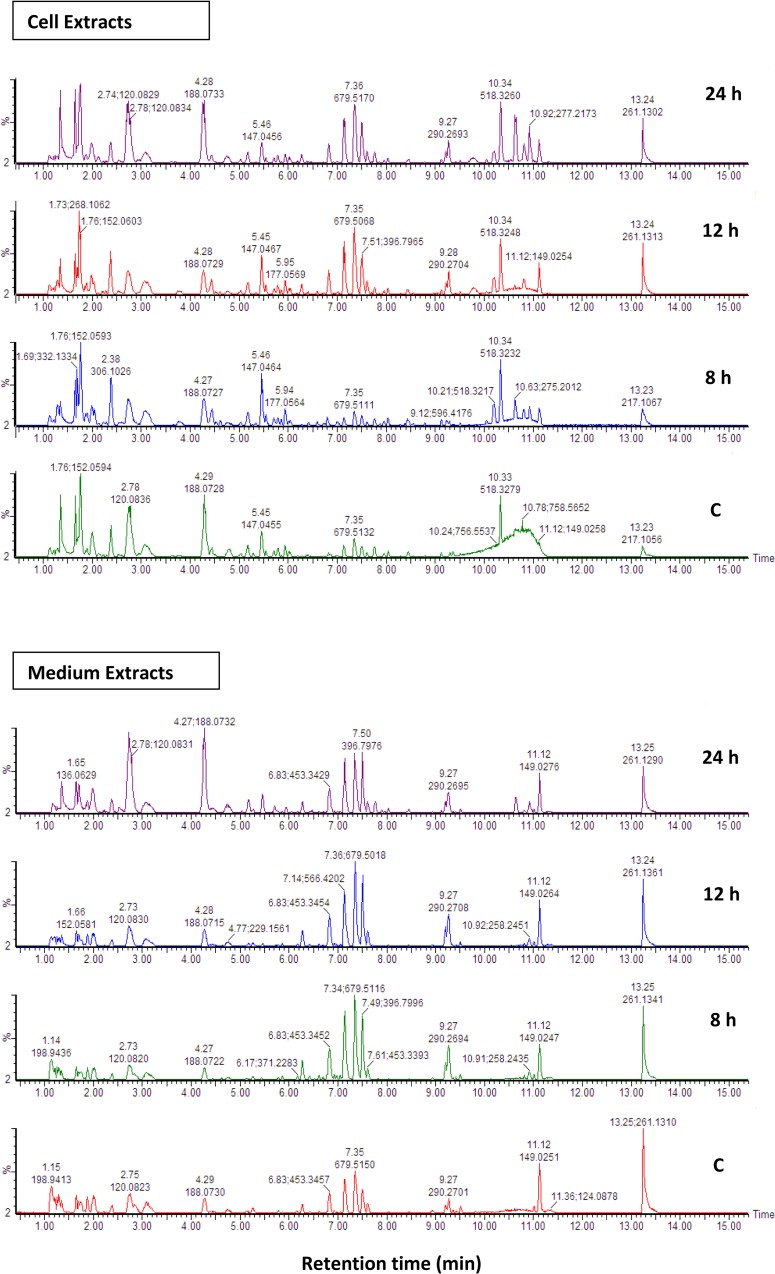
Lipopolysaccharides (LPSs), as MAMP molecules, trigger the activation of signal transduction pathways involved in defence. Currently, plant metabolomics is providing new dimensions into understanding the intracellular adaptive responses to external stimuli. The effect of LPS on the metabolomes of Arabidopsis thaliana cells and leaf tissue was investigated over a 24 h period. Cellular metabolites and those secreted into the medium were extracted with methanol and liquid chromatography coupled to mass spectrometry was used for quantitative and qualitative analyses. Multivariate statistical data analyses were used to extract interpretable information from the generated multidimensional LC-MS data. The results show that LPS perception triggered differential changes in the metabolomes of cells and leaves, leading to variation in the biosynthesis of specialised secondary metabolites. Time-dependent changes in metabolite profiles were observed and biomarkers associated with the LPS-induced response were tentatively identified. These include the phytohormones salicylic acid and jasmonic acid, and also the associated methyl esters and sugar conjugates. The induced defensive state resulted in increases in indole-and other glucosinolates, indole derivatives, camalexin as well as cinnamic acid derivatives and other phenylpropanoids. These annotated metabolites indicate dynamic reprogramming of metabolic pathways that are functionally related towards creating an enhanced defensive capacity. The results reveal new insights into the mode of action of LPS as an activator of plant innate immunity, broadens knowledge about the defence metabolite pathways involved in Arabidopsis responses to LPS, and identifies specialised metabolites of functional importance that can be employed to enhance immunity against pathogen infection.
Conflict of interest statement
The authors have declared that no competing interests exist.
Figures


Similar articles
-
Untargeted Metabolomics Profiling of Arabidopsis WT, lbr-2-2 and bak1-4 Mutants Following Treatment with Two LPS Chemotypes.Metabolites. 2022 Apr 22;12(5):379. doi: 10.3390/metabo12050379. Metabolites. 2022. PMID: 35629883 Free PMC article.
-
Lipopolysaccharide perception in Arabidopsis thaliana: Diverse LPS chemotypes from Burkholderia cepacia, Pseudomonas syringae and Xanthomonas campestris trigger differential defence-related perturbations in the metabolome.Plant Physiol Biochem. 2020 Nov;156:267-277. doi: 10.1016/j.plaphy.2020.09.006. Epub 2020 Sep 16. Plant Physiol Biochem. 2020. PMID: 32987257
-
Multi-platform metabolomic analyses of ergosterol-induced dynamic changes in Nicotiana tabacum cells.PLoS One. 2014 Jan 31;9(1):e87846. doi: 10.1371/journal.pone.0087846. eCollection 2014. PLoS One. 2014. PMID: 24498209 Free PMC article.
-
Secondary metabolites in plant innate immunity: conserved function of divergent chemicals.New Phytol. 2015 May;206(3):948-964. doi: 10.1111/nph.13325. Epub 2015 Feb 6. New Phytol. 2015. PMID: 25659829 Review.
-
Sulfur-containing secondary metabolites from Arabidopsis thaliana and other Brassicaceae with function in plant immunity.Chembiochem. 2012 Sep 3;13(13):1846-59. doi: 10.1002/cbic.201200086. Epub 2012 Jul 16. Chembiochem. 2012. PMID: 22807086 Review.
Cited by
-
Untargeted Metabolomics Profiling of Arabidopsis WT, lbr-2-2 and bak1-4 Mutants Following Treatment with Two LPS Chemotypes.Metabolites. 2022 Apr 22;12(5):379. doi: 10.3390/metabo12050379. Metabolites. 2022. PMID: 35629883 Free PMC article.
-
Comparative Metabolic Phenotyping of Tomato (Solanum lycopersicum) for the Identification of Metabolic Signatures in Cultivars Differing in Resistance to Ralstonia solanacearum.Int J Mol Sci. 2018 Aug 29;19(9):2558. doi: 10.3390/ijms19092558. Int J Mol Sci. 2018. PMID: 30158424 Free PMC article.
-
Effects of LPS from Rhodobacter sphaeroides, a Purple Non-Sulfur Bacterium (PNSB), on the Gene Expression of Rice Root.Microorganisms. 2023 Jun 28;11(7):1676. doi: 10.3390/microorganisms11071676. Microorganisms. 2023. PMID: 37512850 Free PMC article.
-
Effects of Seed Bio-Priming by Purple Non-Sulfur Bacteria (PNSB) on the Root Development of Rice.Microorganisms. 2022 Nov 6;10(11):2197. doi: 10.3390/microorganisms10112197. Microorganisms. 2022. PMID: 36363789 Free PMC article.
-
Adaptive defence-related changes in the metabolome of Sorghum bicolor cells in response to lipopolysaccharides of the pathogen Burkholderia andropogonis.Sci Rep. 2020 May 6;10(1):7626. doi: 10.1038/s41598-020-64186-y. Sci Rep. 2020. PMID: 32376849 Free PMC article.
References
-
- Jones JDG, Dangl JL. The plant immune system. Nature 2006; 444: 323–329. - PubMed
-
- Tugizimana F, Piater LA, Dubery IA. Plant metabolomics: a new frontier in phytochemical analysis. S. Afr. J. Sci. 2013; 109: 1–11.
LinkOut - more resources
Full Text Sources
Other Literature Sources
Molecular Biology Databases
