. 2016 Sep 19;8(9):564.
doi: 10.3390/nu8090564.

Nutrient Intake Is Associated with Longevity Characterization by Metabolites and Element Profiles of Healthy Centenarians

Affiliations

Nutrient Intake Is Associated with Longevity Characterization by Metabolites and Element Profiles of Healthy Centenarians

Da Cai et al. Nutrients. .

Abstract

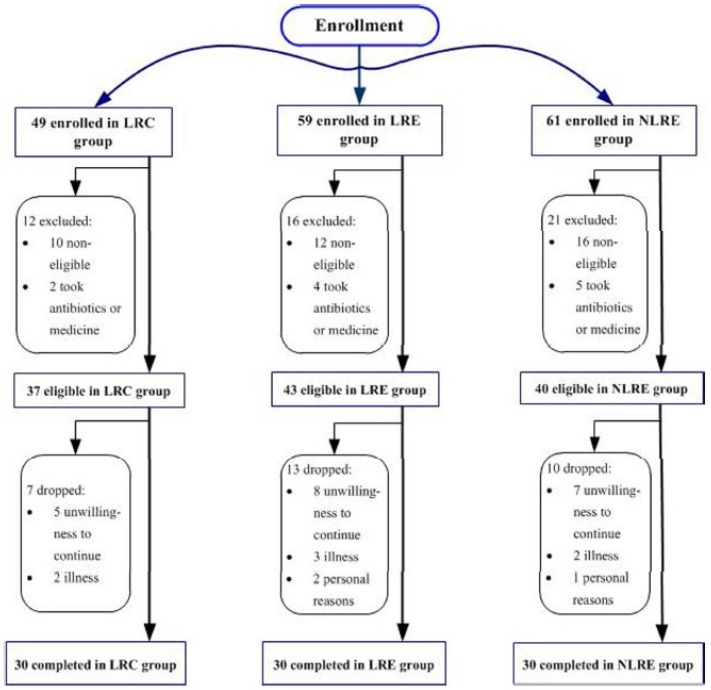
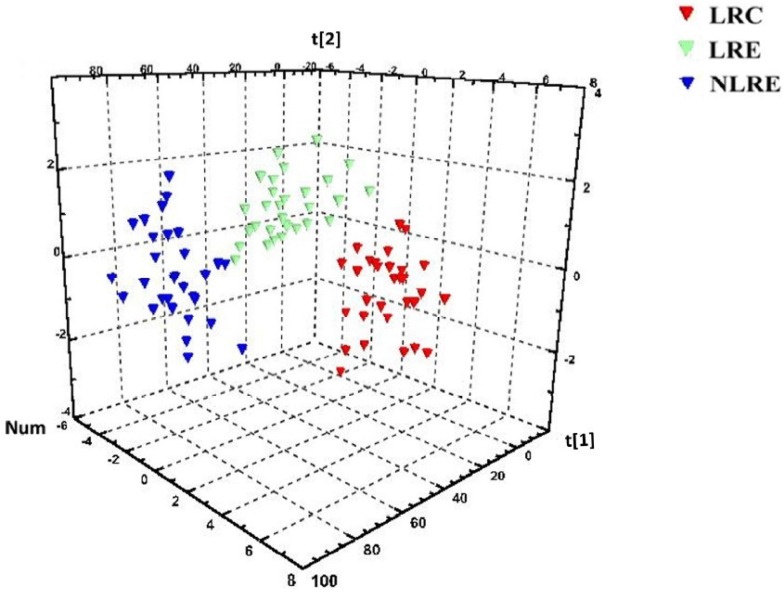
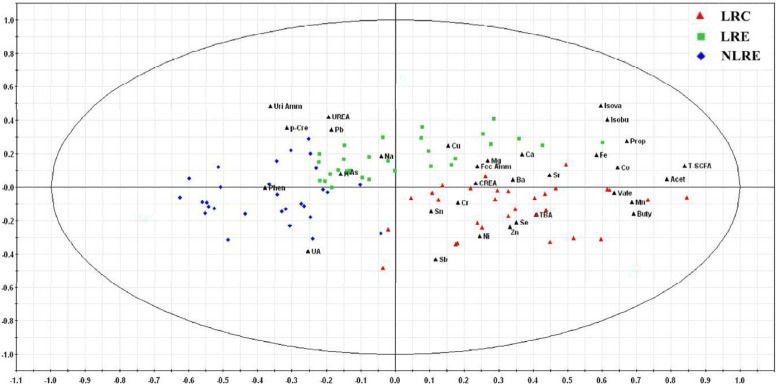
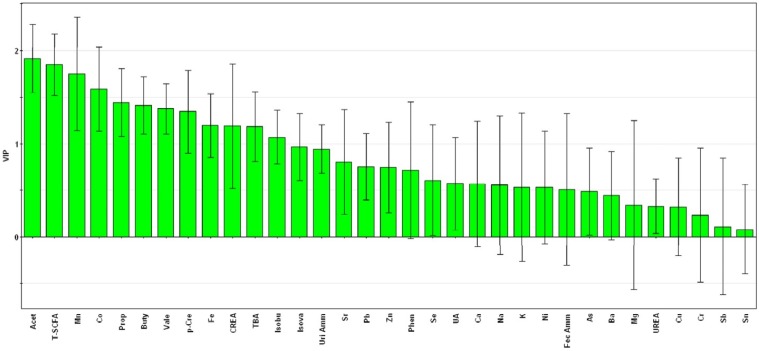
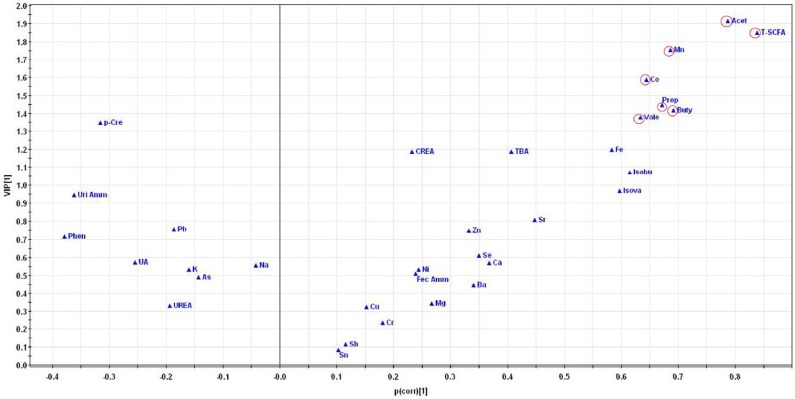
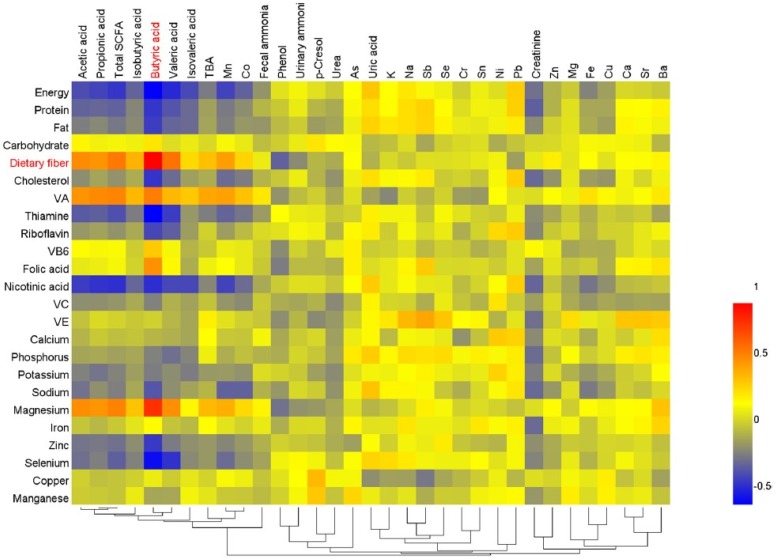
The relationships between diet and metabolites as well as element profiles in healthy centenarians are important but remain inconclusive. Therefore, to test the interesting hypothesis that there would be distinctive features of metabolites and element profiles in healthy centenarians, and that these would be associated with nutrient intake; the short chain fatty acids (SCFAs), total bile acids and ammonia in feces, phenol, p-cresol, uric acid, urea, creatinine and ammonia in urine, and element profiles in fingernails were determined in 90 healthy elderly people, including centenarians from Bama county (China)-a famous longevous region-and elderly people aged 80-99 from the longevous region and a non-longevous region. The partial least squares-discriminant analysis was used for pattern recognition. As a result, the centenarians showed a distinct metabolic pattern. Seven characteristic components closely related to the centenarians were identified, including acetic acid, total SCFA, Mn, Co, propionic acid, butyric acid and valeric acid. Their concentrations were significantly higher in the centenarians group (p < 0.05). Additionally, the dietary fiber intake was positively associated with butyric acid contents in feces (r = 0.896, p < 0.01), and negatively associated with phenol in urine (r = -0.326, p < 0.01). The results suggest that the specific metabolic pattern of centenarians may have an important and positive influence on the formation of the longevity phenomenon. Elevated dietary fiber intake should be a path toward health and longevity.

Keywords: centenarian; element; longevous region; metabolite; nutrient intake; partial least squares-discriminant analysis; pattern recognition.


Conflict of interest statement

The authors declare no conflict of interest.

Figures

Figure 1
Figure 1
Flow diagram of participants during the study.
Figure 2
Figure 2
Scores plot from the partial least squares-discriminant analysis of overall indexes including the metabolites and elements in the three groups. Red symbols represent the participants in the LRC group. Green symbols represent the participants in the LRE group. Blue symbols represent the participants in the NLRE group. Their spatial distribution reveals the variations of the metabolites and element profiles among the three groups. The three groups exhibit a clear separation, indicating that there are differences in the metabolites and element profiles among the three groups. LRC, centenarians from longevous region; LRE, elderly people aged 80–99 years from longevous region; NLRE, elderly people aged 80–99 years from a non-longevous region.
Figure 3
Figure 3
Bi-plot from the partial least squares-discriminant analysis of overall indexes including the metabolites and elements in the three groups. Red triangles represent the participants in the LRC group. Green squares represent the participants in the LRE group. Blue rhombuses represent the participants in the NLRE group. Their spatial distribution reveals the variations of the metabolites and element profiles among the three groups. The three groups exhibit a clear separation, indicating that there are differences in the metabolites and element profiles among the three groups. Moreover, the bi-plot showed that the contents of some beneficial components, such as short chain fatty acids (SCFAs), Mn, Co, Zn and Se, in the LRC group were higher than those in the other two groups. Meanwhile, the contents of some harmful components, such as p-cresol, phenol and ammonia, in the NLRE group were higher. LRC, centenarians from longevous region; LRE, elderly people aged 80–99 years from longevous region; NLRE, elderly people aged 80–99 years from a non-longevous region; Acet, acetic acid; Prop, propionic acid; Buty, butyric acid; Isobu, isobutyric acid; Vale, valeric acid; Isova, isovaleric acid; T-SCFA, total SCFA; TBA, total bile acids; Phen, phenol; p-Cre, p-cresol; UA, uric acid; CREA, creatinine; Fec Amm, fecal ammonia; Uri Amm, urinary ammonia.
Figure 4
Figure 4
Variable importance in the projection (VIP) plot from the partial least squares-discriminant analysis of overall indexes including the metabolites and elements in the three groups. Variables for which the VIP ± 95% confidence interval (CI) exceeds 1 are designated as significant differential components, including acetic acid, total SCFA, Mn, Co, propionic acid, butyric acid and valeric acid. Acet, acetic acid; Prop, propionic acid; Buty, butyric acid; Isobu, isobutyric acid; Vale, valeric acid; Isova, isovaleric acid; T-SCFA, total SCFA; TBA, total bile acids; Phen, phenol; p-Cre, p-cresol; UA, uric acid; CREA, creatinine; Fec Amm, fecal ammonia; Uri Amm, urinary ammonia.
Figure 5
Figure 5
V plot of the partial least squares-discriminant analysis of overall indexes including the metabolites and elements in the three groups. Each triangle denotes an individual component. The triangles far away from the origin represent the components responsible for the differences among the three groups. The acetic acid, total SCFA, Mn, Co, propionic acid, butyric acid and valeric acid are the farthest away from the origin in the V plot, which further indicates that they are the differential components obtained from the PLS-DA model. Acet, acetic acid; Prop, propionic acid; Buty, butyric acid; Isobu, isobutyric acid; Vale, valeric acid; Isova, isovaleric acid; T-SCFA, total SCFA; TBA, total bile acids; Phen, phenol; p-Cre, p-cresol; UA, uric acid; CREA, creatinine; Fec Amm, fecal ammonia; Uri Amm, urinary ammonia.
Figure 6
Figure 6
Correlations between the nutrient intake and metabolites as well as element levels. Red denotes positive correlation, blue denotes negative correlation, and yellow denotes no correlation. There was a significant positive correlation between dietary fiber intake and butyric acid contents in feces, and the correlation coefficient was highest (r = 0.896, p < 0.01). The other short chain fatty acids also were positively associated with dietary fiber intake (p < 0.05). Besides, the dietary fiber intake was negatively associated with the contents of phenol in urine (r = −0.326, p < 0.01).

References

    1. Péter S., Saris W.H.M., Mathers J.C., Feskens E., Schols A., Navis G., Kuipers F., Weber P., Eggersdorfer M. Nutrient status assessment in individuals and populations for healthy aging—Statement from an expert workshop. Nutrients. 2015;7:10491–10500. doi: 10.3390/nu7125547. - DOI - PMC - PubMed
    1. Shi Z., Zhang T., Byles J., Martin S., Avery J.C., Taylor A.W. Food habits, lifestyle factors and mortality among oldest old Chinese: The Chinese longitudinal healthy longevity survey (CLHLS) Nutrients. 2015;7:7562–7579. doi: 10.3390/nu7095353. - DOI - PMC - PubMed
    1. Fontana L., Partridge L., Longo V.D. Extending healthy life span-from yeast to humans. Science. 2010;328:321–326. doi: 10.1126/science.1172539. - DOI - PMC - PubMed
    1. Brunner E.J., Mosdol A., Witte D.R., Martikainen P., Stafford M., Shipley M.J., Marmot M.G. Dietary patterns and 15-year risks of major coronary events, diabetes, and mortality. Am. J. Clin. Nutr. 2008;87:1414–1421. - PubMed
    1. McNiven E.M., German J.B., Slupsky C.M. Analytical metabolomics: Nutritional opportunities for personalized health. J. Nutr. Biochem. 2011;22:995–1002. doi: 10.1016/j.jnutbio.2011.05.016. - DOI - PubMed

LinkOut - more resources