

The mTORC1-Signaling Pathway and Hepatic Polyribosome Profile Are Enhanced after the Recovery of a Protein Restricted Diet by a Combination of Soy or Black Bean with Corn Protein
- PMID: 27657118
- PMCID: PMC5037558
- DOI: 10.3390/nu8090573
The mTORC1-Signaling Pathway and Hepatic Polyribosome Profile Are Enhanced after the Recovery of a Protein Restricted Diet by a Combination of Soy or Black Bean with Corn Protein
Abstract
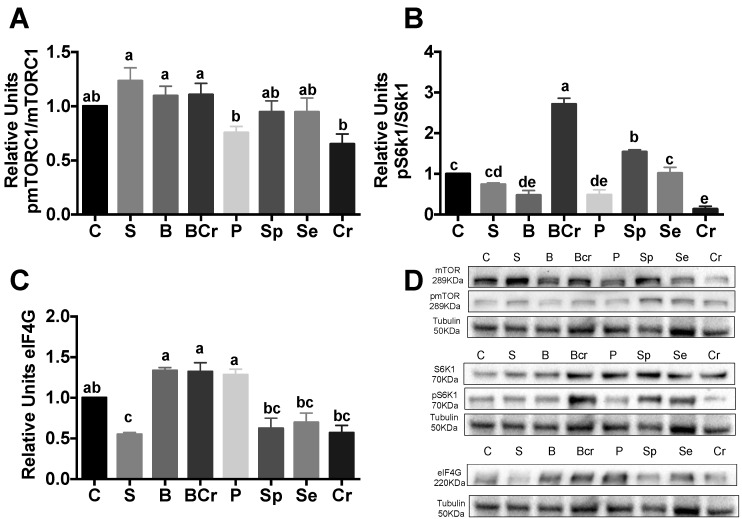
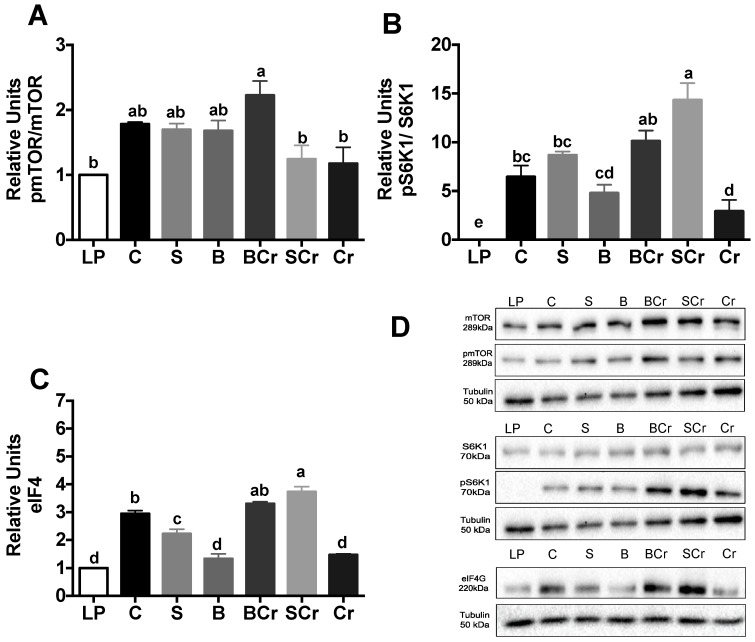
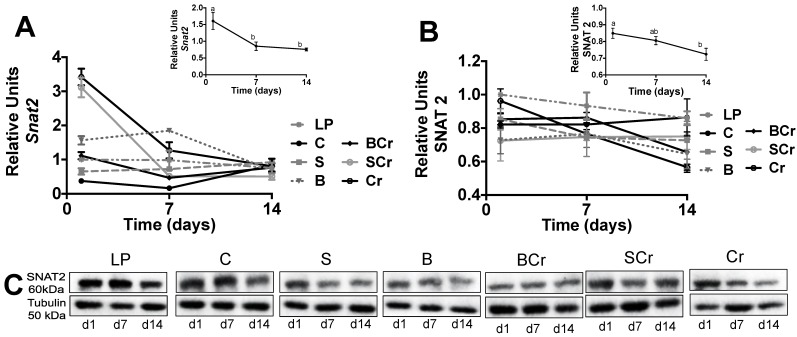
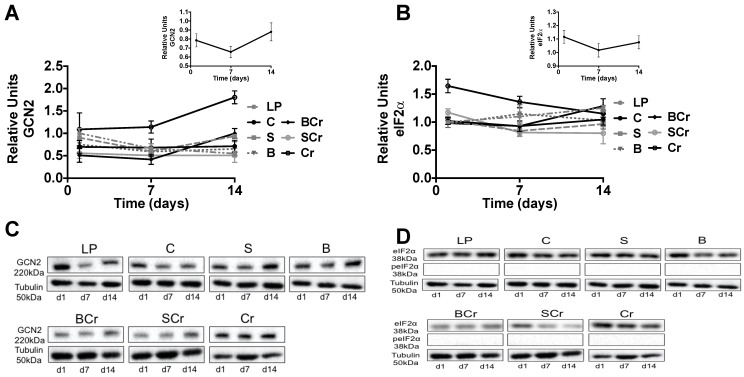
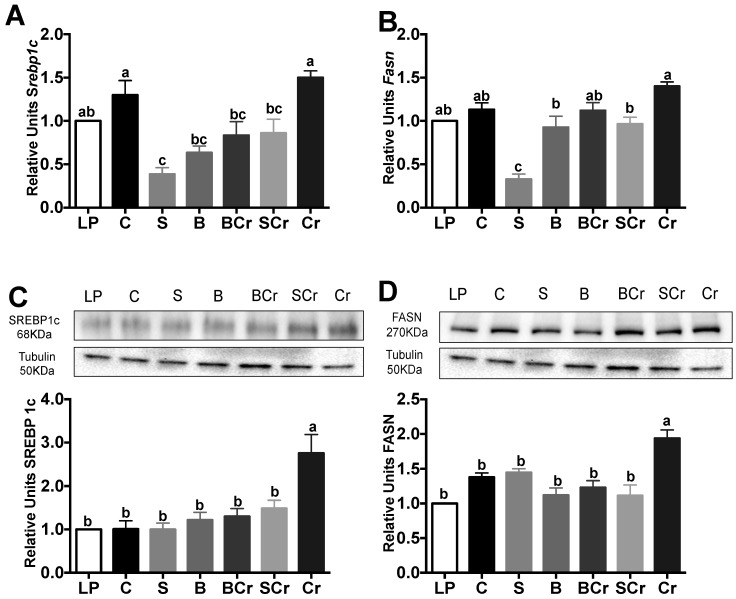
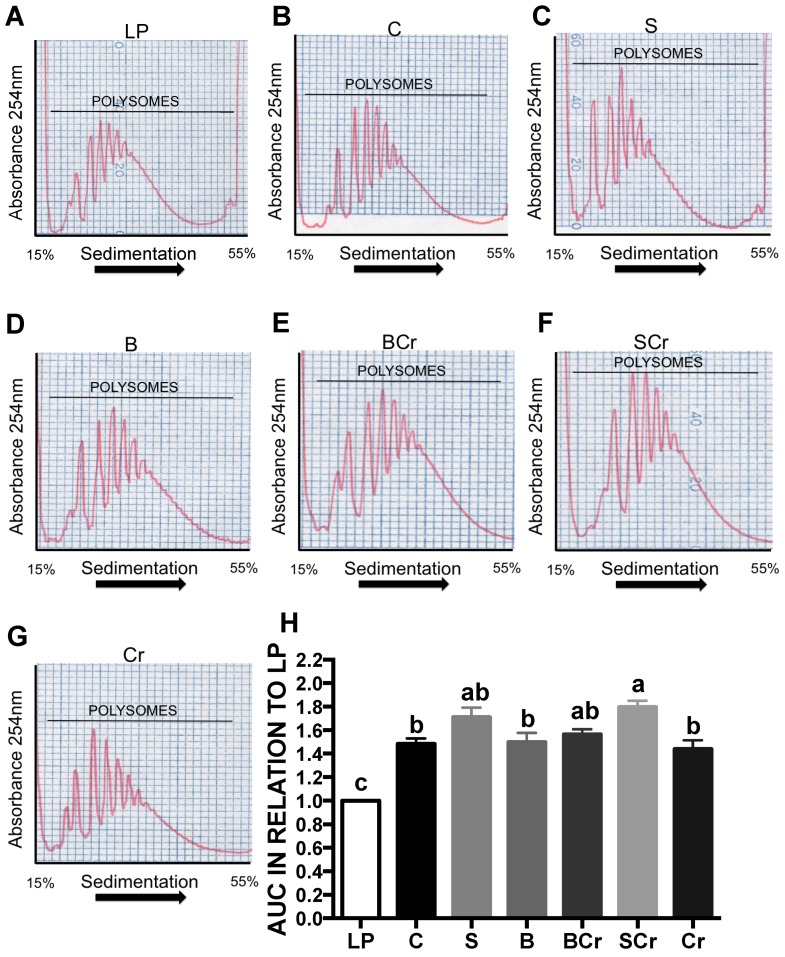
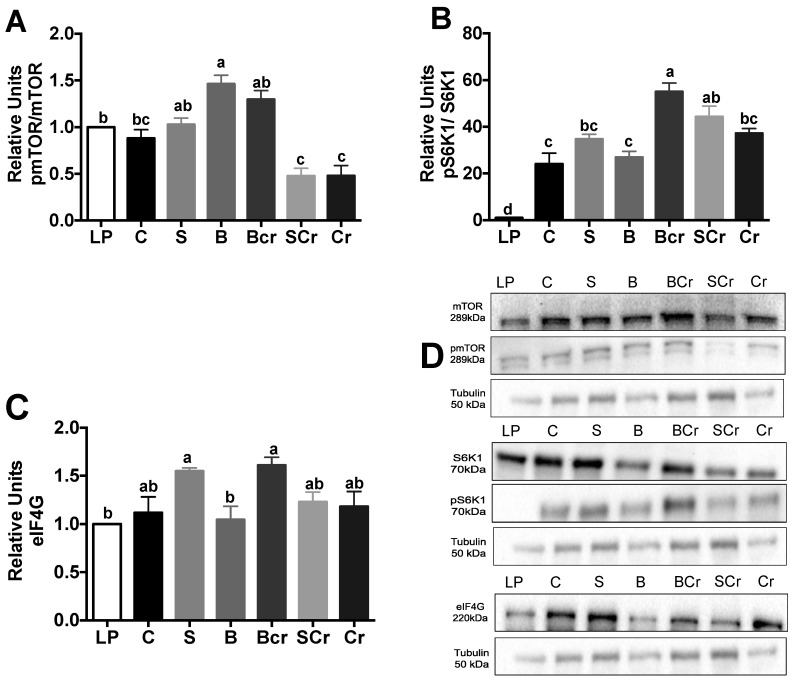
Between 6% and 11% of the world's population suffers from malnutrition or undernutrition associated with poverty, aging or long-term hospitalization. The present work examined the effect of different types of proteins on the mechanistic target of rapamycin (mTORC1)-signaling pathway in: (1) healthy; and (2) protein restricted rats. (1) In total, 200 rats were divided into eight groups and fed one of the following diets: 20% casein (C), soy (S), black bean (B), B + Corn (BCr), Pea (P), spirulina (Sp), sesame (Se) or Corn (Cr). Rats fed C or BCr had the highest body weight gain; rats fed BCr had the highest pS6K1/S6K1 ratio; rats fed B, BCr or P had the highest eIF4G expression; (2) In total, 84 rats were fed 0.5% C for 21 day and protein rehabilitated with different proteins. The S, soy + Corn (SCr) and BCr groups had the highest body weight gain. Rats fed SCr and BCr had the highest eIF4G expression and liver polysome formation. These findings suggest that the quality of the dietary proteins modulate the mTORC1-signaling pathway. In conclusion, the combination of BCr or SCr are the best proteins for dietary protein rehabilitation due to the significant increase in body weight, activation of the mTORC1-signaling pathway in liver and muscle, and liver polysome formation.
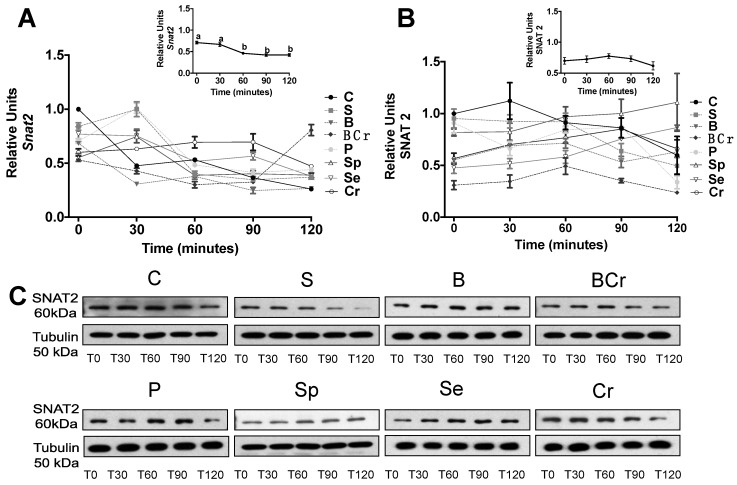
Keywords: SNAT2; black bean protein; mTORC1-signaling pathway; polysome profiling; protein rehabilitation; soy protein.
Conflict of interest statement
The authors declare no conflict of interest.
Figures

Similar articles
-
Regulation of hepatic peroxisome proliferator-activated receptor alpha expression but not adiponectin by dietary protein in finishing pigs.J Anim Physiol Anim Nutr (Berl). 2008 Oct;92(5):569-77. doi: 10.1111/j.1439-0396.2007.00750.x. J Anim Physiol Anim Nutr (Berl). 2008. PMID: 19012601
-
[Effect of the quality and quantity of dietary proteins on vitamin A depletion rate, and biological availability of vitamin A precursors].Arch Latinoam Nutr. 1986 Sep;36(3):415-31. Arch Latinoam Nutr. 1986. PMID: 3632216 Spanish.
-
Effect of Dietary Restriction on Toxicology and Carcinogenesis Studies in F344/N Rats and B6C3F1 Mice.Natl Toxicol Program Tech Rep Ser. 1997 Sep;460:1-414. Natl Toxicol Program Tech Rep Ser. 1997. PMID: 12587016
-
Effect of phytate in soy protein on the serum and liver cholesterol levels and liver fatty acid profile in rats.Biosci Biotechnol Biochem. 2003 Jan;67(1):15-22. doi: 10.1271/bbb.67.15. Biosci Biotechnol Biochem. 2003. PMID: 12619668
-
Diets containing whey proteins or soy protein isolate protect against 7,12-dimethylbenz(a)anthracene-induced mammary tumors in female rats.Cancer Epidemiol Biomarkers Prev. 2000 Jan;9(1):113-7. Cancer Epidemiol Biomarkers Prev. 2000. PMID: 10667471
Cited by
-
Pulse Protein Isolates as Competitive Food Ingredients: Origin, Composition, Functionalities, and the State-of-the-Art Manufacturing.Foods. 2023 Dec 19;13(1):6. doi: 10.3390/foods13010006. Foods. 2023. PMID: 38201034 Free PMC article. Review.
-
Black beans (Glycine max (L.) Merrill) included in a multi-grain rice reduce total cholesterol and enhance antioxidant capacity in high-fat diet-induced obese mice.Food Sci Biotechnol. 2024 Feb 22;33(12):2857-2864. doi: 10.1007/s10068-024-01533-z. eCollection 2024 Sep. Food Sci Biotechnol. 2024. PMID: 39184995 Free PMC article.
-
Low Protein Diets and Plant-Based Low Protein Diets: Do They Meet Protein Requirements of Patients with Chronic Kidney Disease?Nutrients. 2020 Dec 29;13(1):83. doi: 10.3390/nu13010083. Nutrients. 2020. PMID: 33383799 Free PMC article. Review.
-
Anabolic Properties of Mixed Wheat-Legume Pasta Products in Old Rats: Impact on Whole-Body Protein Retention and Skeletal Muscle Protein Synthesis.Nutrients. 2020 May 29;12(6):1596. doi: 10.3390/nu12061596. Nutrients. 2020. PMID: 32485842 Free PMC article.
-
Consumption of Cooked Black Beans Stimulates a Cluster of Some Clostridia Class Bacteria Decreasing Inflammatory Response and Improving Insulin Sensitivity.Nutrients. 2020 Apr 23;12(4):1182. doi: 10.3390/nu12041182. Nutrients. 2020. PMID: 32340138 Free PMC article.
References
-
- Dietary Reference Intakes . The Essential Guide to Nutrient Requirements. The National Academies Press; Washington, DC, USA: 2006.
-
- Food and Agriculture Organization. International Fund for Agricultural Development. World Food Programme . The State of Food in Security in the World 2015. FAO; Rome, Italy: 2015.
LinkOut - more resources
Full Text Sources
Other Literature Sources
