. 2016 Sep 21;91(6):1219-1227.
doi: 10.1016/j.neuron.2016.09.005.

Transformation of the Radial Glia Scaffold Demarcates Two Stages of Human Cerebral Cortex Development

Affiliations

Transformation of the Radial Glia Scaffold Demarcates Two Stages of Human Cerebral Cortex Development

Tomasz J Nowakowski et al. Neuron. .

Abstract

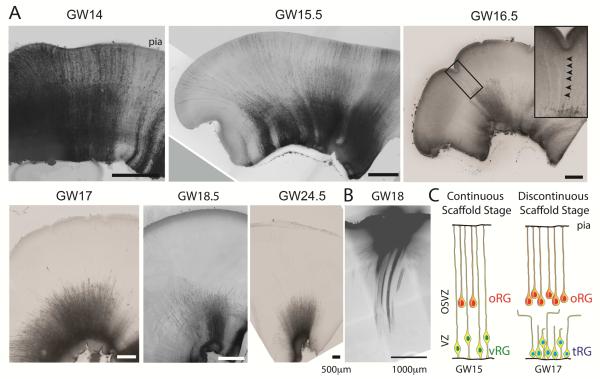
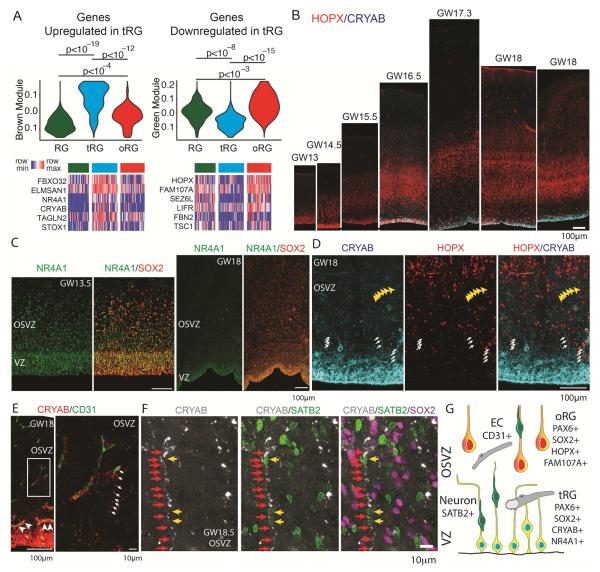
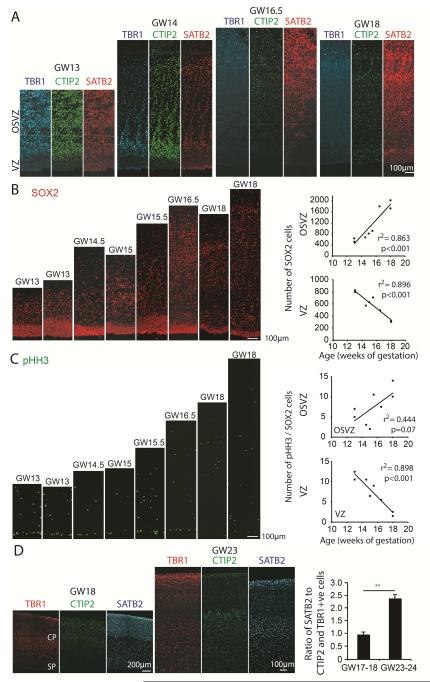
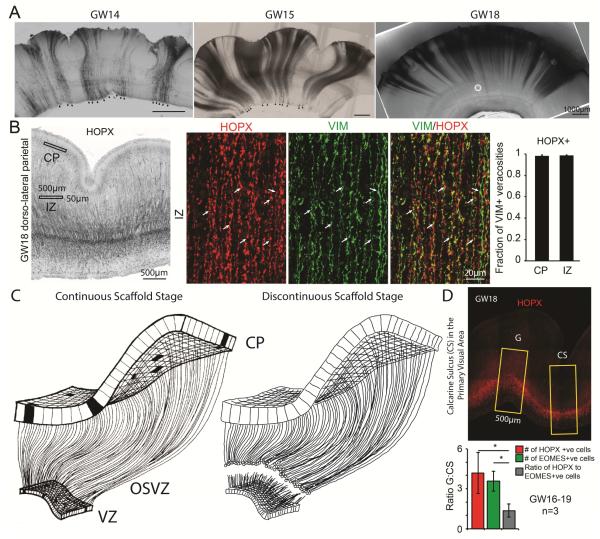
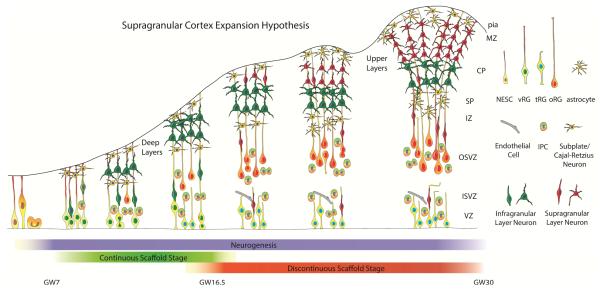
The classic view of cortical development, embodied in the radial unit hypothesis, highlights the ventricular radial glia (vRG) scaffold as a key architectonic feature of the developing neocortex. The scaffold includes continuous fibers spanning the thickness of the developing cortex during neurogenesis across mammals. However, we find that in humans, the scaffold transforms into a physically discontinuous structure during the transition from infragranular to supragranular neuron production. As a consequence of this transformation, supragranular layer neurons arrive at their terminal positions in the cortical plate along outer radial glia (oRG) cell fibers. In parallel, the radial glia that contact the ventricle develop distinct gene expression profile and "truncated" morphology. We propose a supragranular layer expansion hypothesis that posits a deterministic role of oRG cells in the radial and tangential expansion of supragranular layers in primates, with implications for patterns of neuronal migration, area patterning, and cortical folding.


Figures

Figure 1
Figure 1. Morphological Transition in Radial Glia Scaffold During Human Cortical Development
(A) DiI labeling of cells contacting the ventricular surface throughout neurogenesis reveals continuous radial glia scaffold prior to GW16.5, but only shorter “truncated” processes after GW16.5. Arrows indicate sporadic examples of individual fibers extending to the pial surface at GW16.5. See also Figure S1 and S2 for additional examples. (B) Conversely, DiI placement at the pial surface at GW18 labeled fibers extending to the OSVZ, but no ventricular surface contacting cells (See also Figures 3, S4). (C) Schematic representing three major classes of radial glia cells: classical ventricular radial glia (vRG) with fibers extending to the pial surface, ventricle contacting “truncated” radial glia (tRG) with non-classical morphologies whose processes terminate in the OSVZ, and outer radial glia (oRG).
Figure 2
Figure 2. Molecular Identity of Truncated Radial Glia
(A) Violin plots represent distribution of module eigengene values for gene correlation networks upregulated in tRG (module “brown”) and specifically downregulated in tRG cells (module “green”), across previously published single cell RNA-Seq datasets generated for 39 GW14-15 radial glia (RG), 48 GW16-18 tRG cells (previously referred to as vRG cells), and 46 GW16-18 oRG cells (Camp et al., 2015; Pollen et al., 2015). Heatmaps show normalized expression values of representative members of both modules across single cells (see also Supplementary Table 1 for gene module assignments and information about the number of cells of in each class). p-values were calculated using two-way Student t-test. (B) Staining of primary tissue sections for the oRG marker, HOPX and a tRG marker, CRYAB, showing rapid onset of CRYAB expression at around GW16.5. (C) NR4A1 expression is enriched in the VZ during early stages of cortical development and in tRG cells. (D) Representative high magnification image of CRYAB and HOPX immunostaining in the germinal zone. Arrows indicate CRYAB positive tRG fibers and yellow arrowheads indicate an example of a tangentially oriented CRYAB positive fiber consistent with the late tRG fiber morphologies shown in Figure 1. (E) Immunostaining of human germinal zone revealing association of tRG fibers with blood capillaries. Arrowheads indicate examples of CD31-positive endothelial cells surrounded by CRYAB immunostaining of tRG cells. Arrows in the magnified image from the OSVZ highlight an example of a tRG fiber reaching a blood capillary. (F) Representative example of a CRYAB positive tRG fiber in a GW18.5 sample. Red arrows highlight a CRYAB positive fiber and yellow arrows indicate SATB2 positive neuronal cell bodies juxtaposed to the tRG fiber. See also Figure S3 for an example from a GW18.2 specimen. (G) Proposed features of tRG cells include truncated morphology of the basal fiber, distinct molecular identity, and frequent association with blood vessels (EC – endothelial cell).
Figure 3
Figure 3. Expansion of Supragranular Layers During the Discontinuous Stage of Cortical Development
(A) Immunohistochemical detection of newborn neurons in the cortical germinal zone using antibodies for cortical layer markers. (B,C) Immunolabeling and quantification of the total number of SOX2+ cells. (B) SOX2+ cells and phosphorylated Histone H3 and SOX2 double-positive cells (C), in the VZ and OSVZ between GW13 and GW18. The non-linear increase in oRG cell mitoses may reflect dynamic changes in cell cycle parameters over the course of cortical development (Betizeau et al., 2013; Takahashi et al., 1993). Scatter plots represent quantification results of average total number of immunopositive cells for each primary tissue sample shown in the overlying images. Each data point represents a distinct biological replicate, and the quantification was performed in two randomly selected non-adjacent tissue sections, as outlined in Experimental Procedures. Statistical significance was evaluated using linear regression test with p-values displayed above the graph. (D) Left and middle panels show representative examples of immunohistochemical detection of cortical projection neurons around GW18 (left) and GW24 (middle) using antibodies against markers of laminar identity TBR1, CTIP2 (expressed in deep layer neurons), and SATB2 (expressed in upper layer neurons). Quantification of neuronal populations at GW17-18 (n=3, quantification included cortical plate CP and regions containing migrating neurons, IZ and subplate, SP) and at GW 23-24 (n=3). ** - p<0.01, Student’s t-test. Error bars represent s.e.m.
Figure 4
Figure 4. Radial Glia Scaffold Reaching the Cortical Plate During Supragranular Layer Neurogenesis is Formed by oRG Cells
(A) DiI labeling of pia contacting cells throughout human neurogenesis. Consistent with the proposed model, no back-labeled of ventricle contacting cells (arrowheads in left and middle panel) are observed after GW16.5. Note that any apparent folding of the tissue may represent tissue processing artifacts. (B) Validation of cell identity of radial glia fibers in the intermediate zone (IZ) and the cortical plate (CP) using immunohistochemistry. Left image shows representative immunostaining for HOPX, while panels show high magnification example of a fraction of a counting area in the IZ. Arrows indicate varicosities double positive for the pan radial glia marker, VIM, and the outer radial glia marker, HOPX. Quantification represents n=4 (GW17-18.5) biological replicates, error bars represent s.e.m. (C) Two stages of human cerebral cortex development during neurogenesis. Left panel with permission from (Rakic, 2003a). (D) Representative example of HOPX immunostaining of a tissue section through the calcarine sulcus (“CS”) and the adjacent gyrus (“G”) for the oRG marker, HOPX. Quantification was performed in three biological replicates (GW16, GW18, and GW19), total numbers of HOPX and EOMES immunopositive cells in the OSVZ was quantified across two randomly selected non-adjacent tissue sections, as outlined in Experimental Procedures. Bar graph represents the average ratios of OSVZ oRG cells (red bar), IPCs (green bar), and a relative abundance of oRGs to IPCs (gray bar) between the gyrus and the calcarine sulcus. * - p<0.05, paired Student’s t-test. Error bars represent s.e.m.
Figure 5
Figure 5. The Supragranular Cortex Expansion Hypothesis
By integrating experimental evidence in the published literature with our experimental findings we propose that primate cortical neurogenesis can be divided into two stages. During early neurogenesis (left), basal fibers of ventricular radial glia contact the pial surface and newborn neurons migrate along ventricular as well as outer radial glia fibers. During late neurogenesis (right), newborn neurons reach the cortical plate only along outer radial glia fibers. VZ – ventricular zone, NESC – neuroepithelial stem cell, ISVZ – inner subventricular zone, OSVZ – outer subventricular zone, IZ – intermediate zone, SP – subplate, CP – cortical plate, MZ – marginal zone, IPC – intermediate progenitor cell, vRG – ventricular radial glia, tRG – truncated radial glia, oRG – outer radial glia.

References

    1. Angevine JB, Jr., Sidman RL. Autoradiographic study of cell migration during histogenesis of cerebral cortex in the mouse. Nature. 1961;192:766–768. - PubMed
    1. Betizeau M, Cortay V, Patti D, Pfister S, Gautier E, Bellemin-Menard A, Afanassieff M, Huissoud C, Douglas RJ, Kennedy H, et al. Precursor diversity and complexity of lineage relationships in the outer subventricular zone of the primate. Neuron. 2013;80:442–457. - PubMed
    1. Borrell V. In vivo gene delivery to the postnatal ferret cerebral cortex by DNA electroporation. Journal of neuroscience methods. 2010;186:186–195. - PubMed
    1. Bystron I, Rakic P, Molnar Z, Blakemore C. The first neurons of the human cerebral cortex. Nature neuroscience. 2006;9:880–886. - PubMed
    1. Camp JG, Badsha F, Florio M, Kanton S, Gerber T, Wilsch-Brauninger M, Lewitus E, Sykes A, Hevers W, Lancaster M, et al. Human cerebral organoids recapitulate gene expression programs of fetal neocortex development. Proceedings of the National Academy of Sciences of the United States of America. 2015;112:15672–15677. - PMC - PubMed

MeSH terms

LinkOut - more resources