. 2016 Sep 22;11(9):e0162863.
doi: 10.1371/journal.pone.0162863. eCollection 2016.

Normal Development and Function of T Cells in Proline Rich 7 (Prr7) Deficient Mice

Affiliations

Normal Development and Function of T Cells in Proline Rich 7 (Prr7) Deficient Mice

Matous Hrdinka et al. PLoS One. .

Abstract

Transmembrane adaptor proteins (TRAPs) are important organisers for the transduction of immunoreceptor-mediated signals. Prr7 is a TRAP that regulates T cell receptor (TCR) signalling and potently induces cell death when overexpressed in human Jurkat T cells. Whether endogenous Prr7 has a similar functional role is currently unknown. To address this issue, we analysed the development and function of the immune system in Prr7 knockout mice. We found that loss of Prr7 partially impairs development of single positive CD4+ T cells in the thymus but has no effect on the development of other T cell subpopulations, B cells, NK cells, or NKT cells. Moreover, Prr7 does not affect the TCR signalling pathway as T cells derived from Prr7 knockout and wild-type animals and stimulated in vitro express the same levels of the activation marker CD69, and retain their ability to proliferate and activate induced cell death programs. Importantly, Prr7 knockout mice retained the capacity to mount a protective immune response when challenged with Listeria monocytogenes infection in vivo. In addition, T cell effector functions (activation, migration, and reactivation) were normal following induction of experimental autoimmune encephalomyelitis (EAE) in Prr7 knockout mice. Collectively, our work shows that loss of Prr7 does not result in a major immune system phenotype and suggests that Prr7 has a dispensable function for TCR signalling.


Conflict of interest statement

The authors have declared that no competing interests exist.

Figures

Fig 1
Fig 1. Expression analysis of Prr7 in mouse immune system and confirmation of Prr7 gene deletion by PCR and immunoblotting.
(A) qPCR analysis of Prr7 in mouse immune organs in comparison to the brain and purified T cells. The data is normalized to Gapdh and expressed relative to Prr7 levels in the thymus (expression in thymus = 1). (B) qPCR analysis of Prr7 in the thymus and purified thymocytes normalized as in (A). DN, double negative; iSP8, immature single positive cells expressing CD8; DP, double positive; SP4, CD4 single positive; SP8, CD8 single positive cells. (C) qPCR analysis of changes in Prr7 transcript levels upon stimulation of purified lymph node T cells with anti-CD3 (10 μg/ml) + anti-CD28 (1 μg/ml) for 24 h and 48 h. (D) Schematic representation of the Prr7 genomic locus, gene targeting strategy, and an approximate position of primers used for genotyping (a, b, c). LacZ, β-galactosidase, NEO, Neomycin, hUBC, human ubiquitin C promoter, hGHpA, human growth hormone polyadenylation signal sequence. Exons in the Prr7 gene are represented by grey boxes (1, 2, 3). The coding sequence spanning exons 2 and 3 is represented by blue boxes. The Neomycin gene is flanked by LoxP sites represented by red arrows. Schema not drawn to scale. (E) PCR-based mice genotyping strategy using one common reverse primer and two different forward primers specific for the Prr7 genomic locus or the ZEN-UB1 cassette as depicted in (D). (F) Immunoblotting of Prr7 protein levels in whole brain extracts from Prr7+/+ and Prr7-/- mice. Blotting for tubulin served as a loading control. MW, molecular weight. Data in (A-C) represent the mean +SEM, n = 3.
Fig 2
Fig 2. T cell development is largely unaffected in Prr7-deficient mice.
(A) Total numbers of nucleated cells in the thymus (left) and spleen (right) isolated from Prr7+/+ and Prr7-/- mice as counted using a haemocytometer. (B) Schematic representation of T cell developmental stages in the thymus. DN, double negative, DP, double positive, SP, single positive. Lower panels with dot plots are representative examples of flow cytometry analysis of thymocyte subpopulations. Percentages of DN subpopulations (C), DP subpopulations (D), and SP subpopulations (E) in thymi of Prr7+/+ and Prr7-/- mice as analysed by flow cytometry. (F) Flow cytometry analysis of CD4+ and CD8+ T cells subpopulations in the secondary lymphatic organs spleen and lymph nodes expressed as percentage of total. (G) Flow cytometry analysis of splenic CD3+ T cells expressing markers of naïve T cells (CD62+CD25-), activated T cells (CD62L-CD25+), or memory T cells (CD62L-CD25+). Data in (A-G) represent the mean +SEM, n = 3–8. *p < 0.05, n.s., not significant.
Fig 3
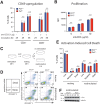
Fig 3. TCR response and AICD is unaffected in T cells from Prr7-deficient mice.
(A) Flow cytometry analysis of the activation marker CD69 in Prr7-deficient CD4+ or CD8+ T cells stimulated with 1 μg of plate-bound anti-CD3 for 24 or 36 h. (B) Proliferation of Prr7+/+ and Prr7-/- splenocytes in response to TCR stimulation with plate-bound anti-CD3 measured as [3H]thymidine incorporation (DNA synthesis). cpm, counts per minute. (C) Schema of the in vitro AICD induction protocol. (D) Representative examples of flow cytometry analysis of AICD in T cells upon restimulation. Live = PI-Annexin V-, Apoptotic = PI-Annexin V+, Dead = PI+Annexin V+ (E) Quantification and statistical analysis of AICD performed as shown in (D). (F) Immunoblotting of c-Jun total levels in restimulated T cells isolated from three different wild-type and knockout mice (#1, #2, #3). Tubulin served as a loading control. Data in (A, B, D) represent the mean + SEM of at least three animals per group. n.s., not significant.
Fig 4
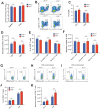
Fig 4. Prr7 deficiency does not influence T cell response to Listeria monocytogenes infection.
(A) Prr7-/- mice and Prr7+/+ control mice were i.v. infected with 1x10⁴ Lm ova. On day 9 post infection, colony forming units were determined in spleen and liver. (B) Representative dot plot of CD4+ and CD8+ T cells in the spleen of infected mice. (C) Frequency of CD4+ and CD8+ T cells in the spleen of infected mice. (D) Absolute number of CD4+ and CD8+ T cells in the spleen of infected mice. (E) Frequency of CD8+ naive (CD62L+CD44-), activated (CD62L-CD44+) and memory (CD62L+CD44+) T cells in the spleen of infected mice. (F) Absolute number of CD8+ naive, activated and memory T cells in the spleen of infected mice. (G-K) Splenocytes of infected mice were restimulated with Ova257-264-peptide (SIINFEKL, 10−8 M) or left unstimulated for 12 h in the presence of Brefeldin A, to allow for the intracellular accumulation of cytokines. (G) Dot plot of IFN-γ and TNF-producing CD8+ T cells without restimulation. (H) Dot plot of TNF-producing CD8+ T cells after restimulation. (I) Dot plot of IFN-γ producing CD8+ T cells after restimulation. (J) Frequency of IFN-γ and TNF-producing CD8+ T cells in the spleen of infected mice. (K) Absolute number of IFN-γ and TNF-producing CD8+ T cells in the spleen of infected mice. Data are represented as mean ± SEM of 4–5 mice per group. n.s. not significant.
Fig 5
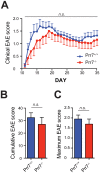
Fig 5. Absence of Prr7 does not affect the susceptibility of mice to EAE.
(A) Clinical EAE scores in 8–12 week old WT and Prr7 knockout female mice upon immunization with MOG peptide over time. (B) Cumulative EAE score from (A). (C) Maximum EAE scores from (A). Data are represented as mean +/- SEM of 13 (Prr7-/-) and 14 (Prr7+/+) mice per group from two independent experiments. n.s. not significant.

Similar articles

Cited by

References

    1. Horejsi V, Zhang W, Schraven B. Transmembrane adaptor proteins: organizers of immunoreceptor signalling. Nat Rev Immunol. 2004;4(8): 603–616. 10.1038/nri1414 - DOI - PubMed
    1. Simeoni L, Lindquist JA, Smida M, Witte V, Arndt B, Schraven B. Control of lymphocyte development and activation by negative regulatory transmembrane adapter proteins. Immunol Rev. 2008;224: 215–228. 10.1111/j.1600-065X.2008.00656.x - DOI - PubMed
    1. Stepanek O, Draber P, Horejsi V. Palmitoylated transmembrane adaptor proteins in leukocyte signaling. Cell Signal. 2014;26(5): 895–902. 10.1016/j.cellsig.2014.01.007 - DOI - PubMed
    1. Fuller DM, Zhang W. Regulation of lymphocyte development and activation by the LAT family of adapter proteins. Immunol Rev. 2009;232(1): 72–83. 10.1111/j.1600-065X.2009.00828.x - DOI - PMC - PubMed
    1. Balagopalan L, Coussens NP, Sherman E, Samelson LE, Sommers CL. The LAT story: a tale of cooperativity, coordination, and choreography. Cold Spring Harb Perspect Biol. 2010;2(8): a005512 10.1101/cshperspect.a005512 - DOI - PMC - PubMed