. 2016 Nov;44(10):2846-2857.
doi: 10.1111/ejn.13410. Epub 2016 Oct 16.

Optogenetic activation of melanin-concentrating hormone neurons increases non-rapid eye movement and rapid eye movement sleep during the night in rats

Affiliations

Optogenetic activation of melanin-concentrating hormone neurons increases non-rapid eye movement and rapid eye movement sleep during the night in rats

Carlos Blanco-Centurion et al. Eur J Neurosci. 2016 Nov.

Abstract

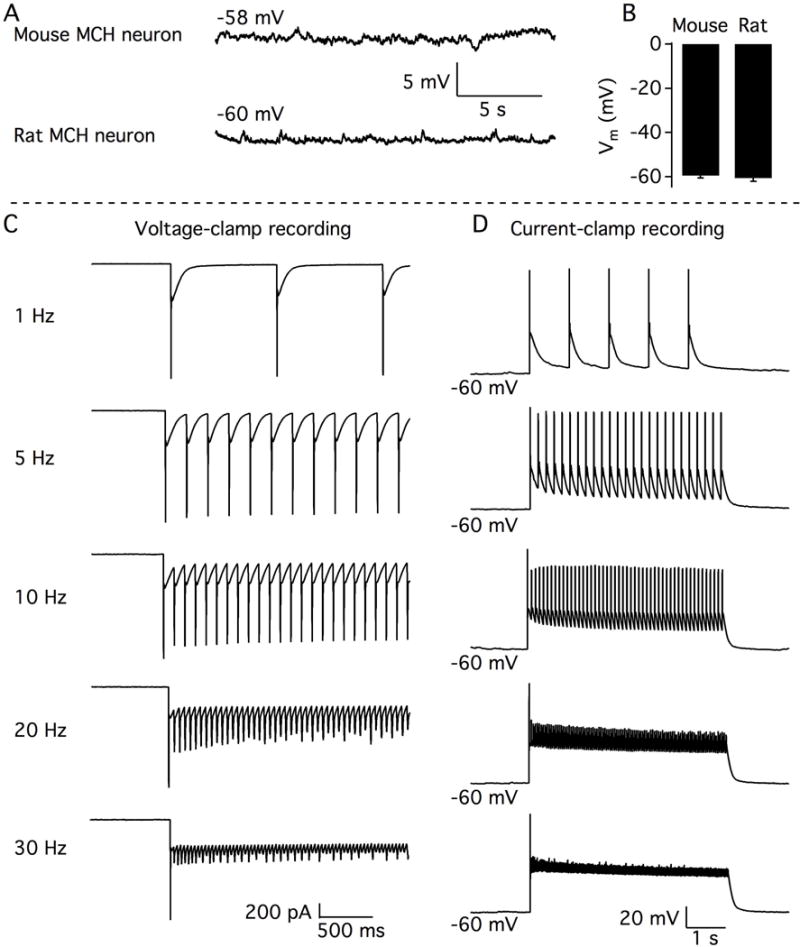
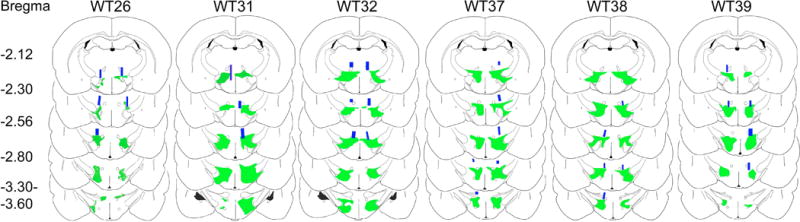
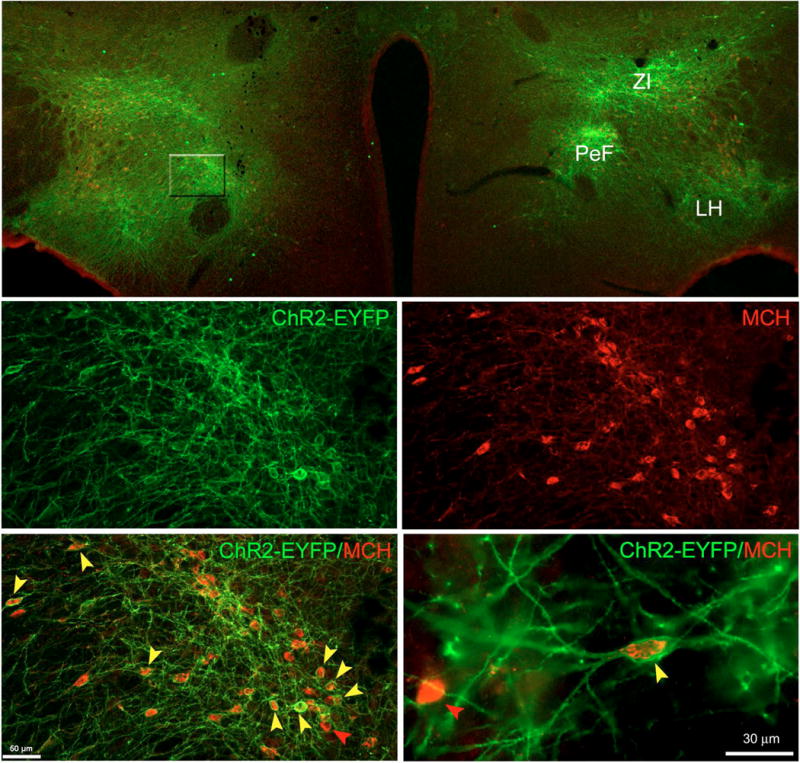
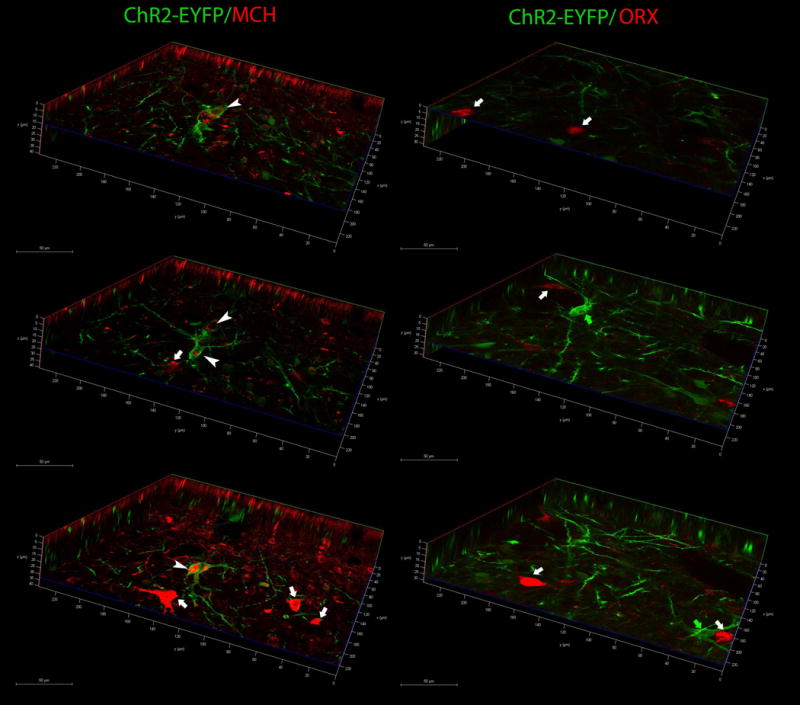
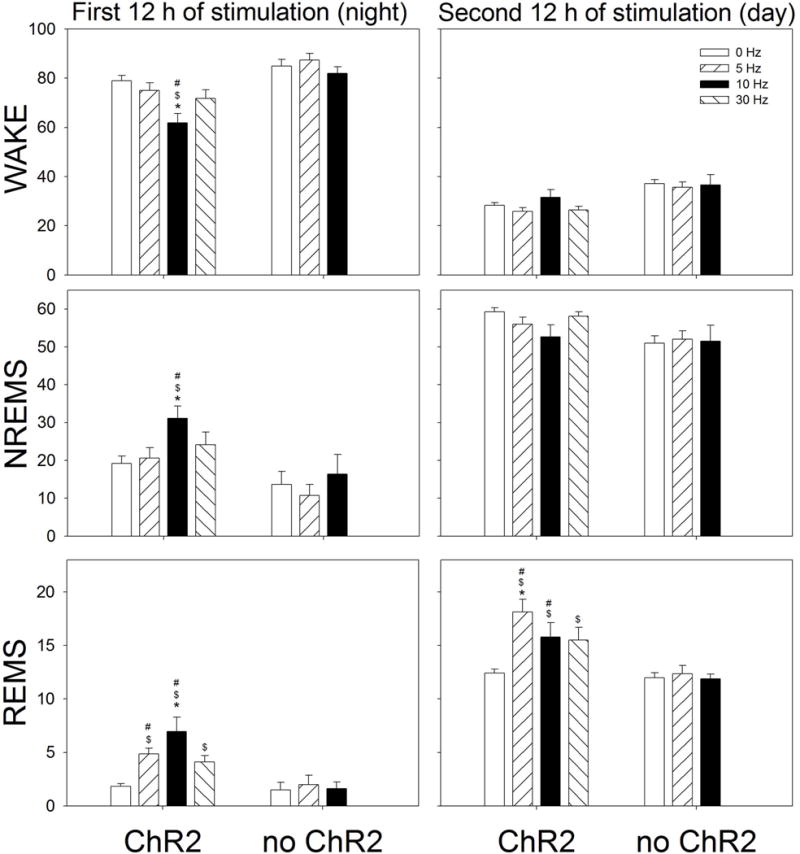
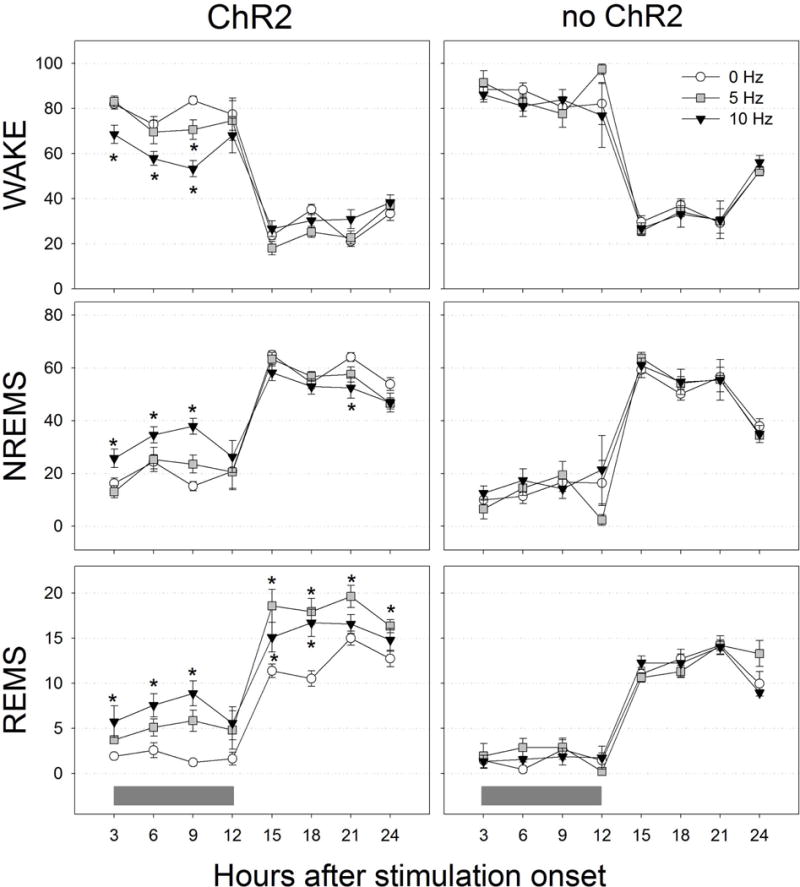
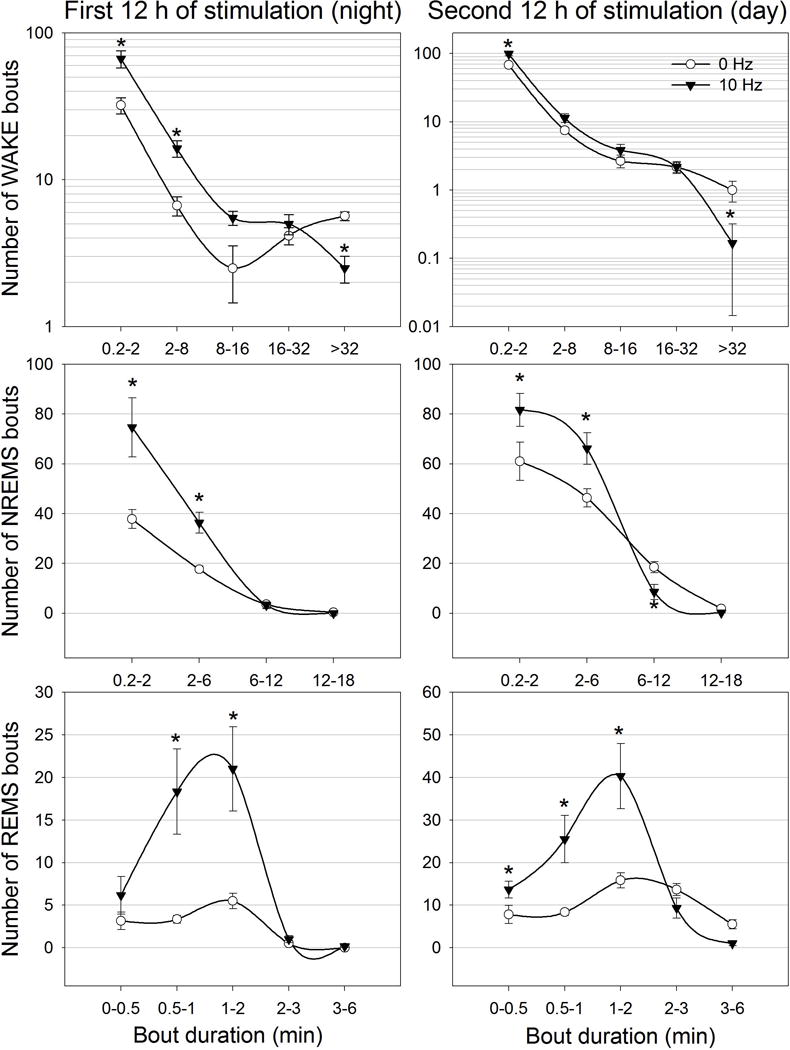
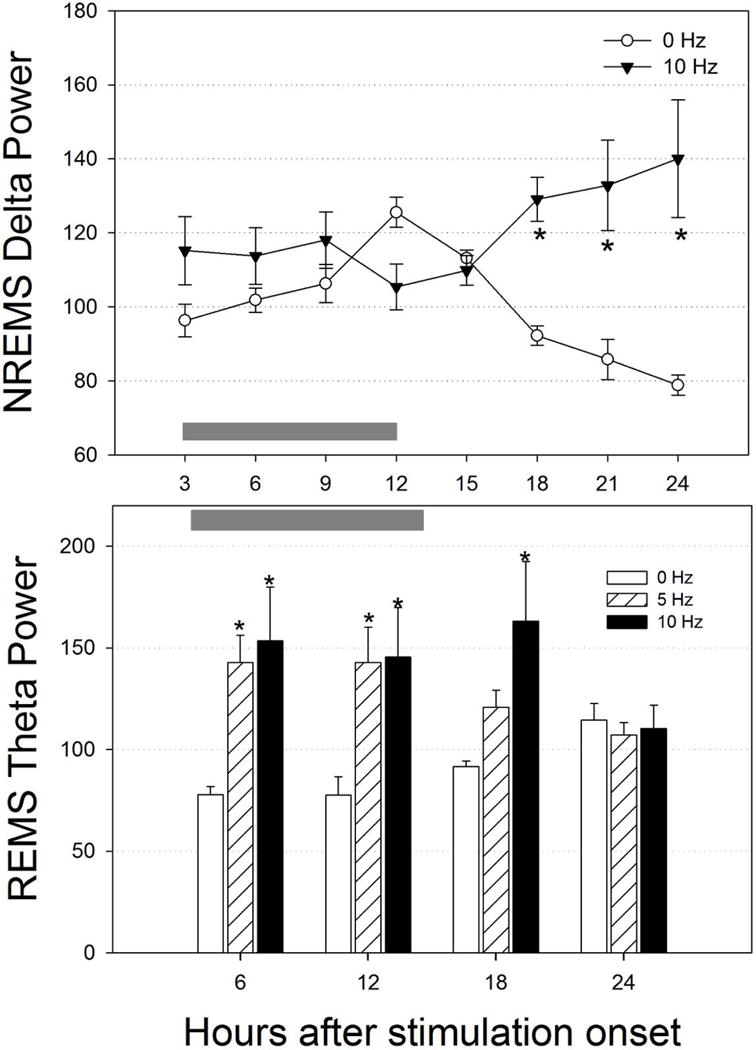
Neurons containing melanin-concentrating hormone (MCH) are located in the hypothalamus. In mice, optogenetic activation of the MCH neurons induces both non-rapid eye movement (NREM) and rapid eye movement (REM) sleep at night, the normal wake-active period for nocturnal rodents [R. R. Konadhode et al. (2013) J. Neurosci., 33, 10257-10263]. Here we selectively activate these neurons in rats to test the validity of the sleep network hypothesis in another species. Channelrhodopsin-2 (ChR2) driven by the MCH promoter was selectively expressed by MCH neurons after injection of rAAV-MCHp-ChR2-EYFP into the hypothalamus of Long-Evans rats. An in vitro study confirmed that the optogenetic activation of MCH neurons faithfully triggered action potentials. In the second study, in Long-Evans rats, rAAV-MCH-ChR2, or the control vector, rAAV-MCH-EYFP, were delivered into the hypothalamus. Three weeks later, baseline sleep was recorded for 48 h without optogenetic stimulation (0 Hz). Subsequently, at the start of the lights-off cycle, the MCH neurons were stimulated at 5, 10, or 30 Hz (1 mW at tip; 1 min on - 4 min off) for 24 h. Sleep was recorded during the 24-h stimulation period. Optogenetic activation of MCH neurons increased both REM and NREM sleep at night, whereas during the day cycle, only REM sleep was increased. Delta power, an indicator of sleep intensity, was also increased. In control rats without ChR2, optogenetic stimulation did not increase sleep or delta power. These results lend further support to the view that sleep-active MCH neurons contribute to drive sleep in mammals.

Keywords: channelrhodopsin-2; melanin-concentrating hormone; rapid eye movement sleep; rat; recombinant adeno-associated virus.


Conflict of interest statement

No conflicts of interest, financial or otherwise are declared by the author(s).

Figures

Figure 1
Figure 1
In vitro optogenetic activation of MCH neurons. A.- Representative traces showing membrane potentials recorded from a typical mouse MCH neuron (above) and a typical rat MCH neuron (bottom). Note how MCH neurons in both species are silent. B.- Bar graph showing similar resting membrane potential of MCH neurons from mice and rats. C.- Representative traces from rat MCH neurons showing the inward currents evoked by photostimulation of different frequencies under whole-cell voltage-clamp recording with cells held at −60 mV. D.- Representative traces showing the membrane depolarization and action potentials evoked by photostimulation of different frequencies under whole-cell current-clamp recording.
Figure 2
Figure 2
Anatomical distribution maps of ChR2-EYFP+ expression in rats. ChR2-EYFP expression was evident across the dorsolateral tuberal hypothalamic area particularly within the zona incerta, perifornical, and lateral hypothalamus. ChR2-EYFP emission signal was less prominent in the medial aspect of hypothalamus. Overall EYFP emission signal spread roughly 1.4 mm along the anteroposterior axis and it was present in both hemispheres. Just above the EYFP emission signal, the blue rectangles indicate the locations of the optic fiber tips. Optic fiber locations were drawn based on the presence of its tracks. The alphanumeric codes on top represent the identification number of the rat whereas the numbers on the far left represent the anterior-posterior distance from bregma.
Figure 3
Figure 3
rAAV-MCH-ChR2-EYFP vector successfully transfected MCH neurons. Top panel shows a panoramic view (4×) of the extent of transfection following a bilateral injection of rAAV-MCH-ChR2-EYFP. Confocal laser scanning microscopy indicated a robust expression of the reporter gene EYFP (green) across the lateral hypothalamus (LH), perifornical area (PeF) and the zona incerta (ZI). Middle magnification (20×) views of the PeF area (middle and bottom left panels). ChR2-EYFP signal is abundantly present in many somata but mostly its neuropil (middle left panel). Middle right panel shows that PeF contains many MCH-ir+ neurons. Bottom left panel illustrates the abundance of EYFP and MCH co-labeling. Bottom right panel was taken at 60× and it shows in great detail ChR2-EYFP expression associated to the plasma membrane of the neuron whereas MCH signal is located within the neuron’s cytoplasm. Cell counts were done at 60×. There was a selective expression of EYFP in MCH neurons (97.3± 0.97%), but 52.5 (± 2.0)% of MCH neurons were also EYFP+. Red arrows indicate examples of non-transfected MCH neurons whereas yellow arrows point toward multiple examples of positively transfected MCH neurons.
Figure 4
Figure 4
EYFP colocalizes with MCH neurons but not with orexin (ORX) neurons. Confocal microscopy photomicrographs depict renderings of Z-stacks in XYZ planes. Left panel depicts colocalization of ChR2-EYFP in MCH-immunoreactive neurons, and right panel shows colocalization in orexin-ir neurons. Images were taken from sections from the same rat shown in figure 3 (WT38). Representative neurons are identified with arrowheads or arrows. White arrowheads identify double labeled somata (EYFP+MCH), white arrows identify either single MCH-ir (left panels) or ORX-ir (right panels) neurons, and green arrows identify single-labeled EYFP+ neurons. X axis=green line, Y axis=red line, Z=axis=blue line. Scale bars indicate the distance in microns.
Figure 5
Figure 5
Effect of optogenetic stimulation of MCH neurons on percent (±SEM) of Wake, NREM sleep and REM sleep. The data summarizes the average percent of wake, NREM sleep and REM sleep during the 12 h period (night or day). Optogenetic stimulation started at lights-off and continued for 24 h (1 min on, 4 min off). *= significance versus 5, 10 or 30Hz within the ChR2 group (p=0.01). $= significance versus 0Hz ChR2 (p<0.02). #= significance versus no ChR2 (p=0.05) (Holm-Sidak post-hoc test after 2-RMANOVA).
Figure 6
Figure 6
Time course of changes in wake, NREM sleep and REM sleep during 24 h of optogenetic stimulation. Stimulation started at night (lights-off). Grey horizontal bars at the bottom indicate the lights-off period. Data are 3 h percent (±SEM). *=significance versus 0 Hz (p=0.05; Holm-Sidak post-hoc test).
Figure 7
Figure 7
Effects of 24 h of optogenetic activation of MCH neurons on sleep architecture. The first 12 h of stimulation occurred during the lights-off period whereas the second 12 h occurred during the lights-on period. To better visualize differences between treatments the number of waking bouts are expressed as log10 scale. NREMS and REMS bouts numbers are represented as linear scale. *=significance versus 0 Hz at p=0.01.
Figure 8
Figure 8
Effect of optogenetic activation of rat MCH neurons on NREMS delta power and REMS theta power. ECoG power was determined only during NREM sleep (delta) or REM sleep (theta). To improve visualization hourly data was pooled in 3 h blocks for delta power and in 6 h for theta power. Gray horizontal bars denote the 12h lights-off, night period. *=significance versus 0 Hz (p=0.01).

References

    1. Adamantidis AR, Zhang F, Aravanis AM, Deisseroth K, de Lecea L. Neural substrates of awakening probed with optogenetic control of hypocretin neurons. Nature. 2007;450:420–424. - PMC - PubMed
    1. Ahnaou A, Dautzenberg FM, Huysmans H, Steckler T, Drinkenburg WH. Contribution of melanin-concentrating hormone (MCH1) receptor to thermoregulation and sleep stabilization: evidence from MCH1 (−/−) mice. Behavioural brain research. 2011;218:42–50. - PubMed
    1. Ahnaou A, Drinkenburg WH, Bouwknecht JA, Alcazar J, Steckler T, Dautzenberg FM. Blocking melanin-concentrating hormone MCH1 receptor affects rat sleep-wake architecture. European journal of pharmacology. 2008;579:177–188. - PubMed
    1. Apergis-Schoute J, Iordanidou P, Faure C, Jego S, Schone C, Aitta-Aho T, Adamantidis A, Burdakov D. Optogenetic evidence for inhibitory signaling from orexin to MCH neurons via local microcircuits. The Journal of neuroscience: the official journal of the Society for Neuroscience. 2015;35:5435–5441. - PMC - PubMed
    1. Aston-Jones G, Bloom FE. Nonrepinephrine-containing locus coeruleus neurons in behaving rats exhibit pronounced responses to non-noxious environmental stimuli. J Neurosci. 1981;1:887–900. - PMC - PubMed

Publication types

MeSH terms

LinkOut - more resources