. 2016 Sep 22;11(9):e0162209.
doi: 10.1371/journal.pone.0162209. eCollection 2016.

Novel Strategy for Phenotypic Characterization of Human B Lymphocytes from Precursors to Effector Cells by Flow Cytometry

Affiliations

Novel Strategy for Phenotypic Characterization of Human B Lymphocytes from Precursors to Effector Cells by Flow Cytometry

Giovanna Clavarino et al. PLoS One. .

Abstract

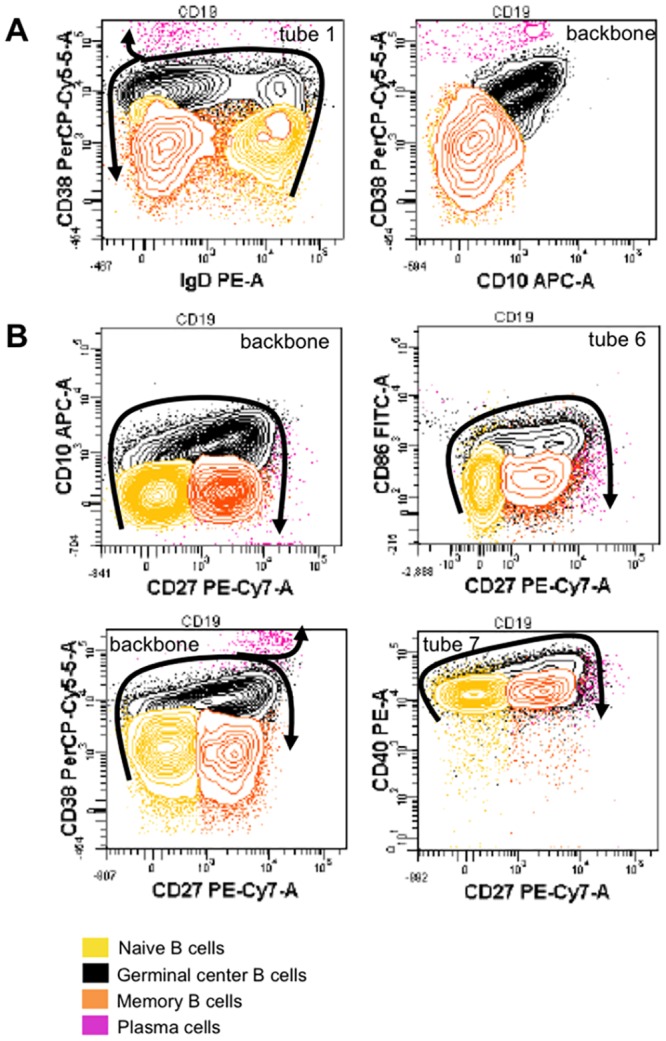
A precise identification and phenotypic characterization of human B-cell subsets is of crucial importance in both basic research and medicine. In the literature, flow cytometry studies for the phenotypic characterization of B-lymphocytes are mainly focused on the description of a particular cell stage, or of specific cell stages observed in a single type of sample. In the present work, we propose a backbone of 6 antibodies (CD38, CD27, CD10, CD19, CD5 and CD45) and an efficient gating strategy to identify, in a single analysis tube, a large number of B-cell subsets covering the whole B-cell differentiation from precursors to memory and plasma cells. Furthermore, by adding two antibodies in an 8-color combination, our approach allows the analysis of the modulation of any cell surface marker of interest along B-cell differentiation. We thus developed a panel of seven 8-colour antibody combinations to phenotypically characterize B-cell subpopulations in bone marrow, peripheral blood, lymph node and cord blood samples. Beyond qualitative information provided by biparametric representations, we also quantified antigen expression on each of the identified B-cell subsets and we proposed a series of informative curves showing the modulation of seventeen cell surface markers along B-cell differentiation. Our approach by flow cytometry provides an efficient tool to obtain quantitative data on B-cell surface markers expression with a relative easy-to-handle technique that can be applied in routine explorations.


Conflict of interest statement

The authors have declared that no competing interests exist.

Figures

Fig 1
Fig 1. Strategy of identification of the B-cell subpopulations with the backbone antibodies (CD38, CD27, CD10, CD19, CD45, CD5) and IgM and IgD markers.
Fig 2
Fig 2. Phenotypic chatacterization of B-cell subsets.
Fig 3
Fig 3. Gating strategy for B-cell subsets’ identification.
Dot plots on blue background identify subpopulations from the antibody backbone. HG 1: hematogones stage 1, HG 2: hematogones stage 2, IMM B: immature B cells, TR B: transitional B cells, N B: naive B cells, GC B: germinal center B cells, M B: memory B cells, NM B: natural B memory cells, MM B: non-switched memory B cells, SM B: switched memory B cells, PC: plasma cells.
Fig 4
Fig 4. Graphical representation of the frequency (mean ± SD) of each stage of B-cell differentiation identified in the different types of samples.
Samples of different anatomical sites (bone marrow, peripheral blood, lymph node and cord blood) were stained with the antibody combination of tube 1 of the panel and analyzed with the gating strategy shown in Fig 2 in order to identify ten B-cell subsets. Cell frequency has been quantified by calculating the mean of % of cells of each subset within CD19+ cells (± standard deviation). HG 1: hematogones stage 1, HG 2: hematogones stage 2, IMM B: immature B cells, TR B: transitional B cells, N B: naive B cells, GC B: germinal center B cells, NM B: natural B memory cells, MM B: non-switched memory B cells, SM B: switched memory B cells, PC: plasma cells. Data from three patients for each type of sample are represented.
Fig 5
Fig 5. Biparametric representations of B-cell maturation pathways in the bone marrow.
The modulation of the expression of various cell surface markers versus CD10 expression is represented in dot plots. The specific tube of antibody combination used to analyze the expression of each marker is indicated in each graph, at the upper right. B-cell maturation is shown with arrows, drawn from the most immature B-cell subset to the most mature one. Data from one patient out of three with similar results are here represented.
Fig 6
Fig 6. Biparametric representations of B-cell maturation pathways in the lymph node.
Identification of B-cell subsets in lymph node (A) and analysis of the expression of various cell surface markers versus CD27 expression (B). The specific tube of antibody combination used to analyze the expression of each marker is indicated in each graph, at the upper right. B-cell maturation is shown with arrows, drawn from the most immature. Data from one patient out of three with similar results are here represented.
Fig 7
Fig 7. CD24 and CD44 expression during B cell differentiation in lymph nodes.
CD24 and CD44 markers define two separate subsets within germinal center B cells. Data from one patient out of three with similar results are here represented.
Fig 8
Fig 8. Relative expression patterns of 17 B-cell markers based on median fluorescence intensities (MFI).
Means of MFI of three stage 1 or 2 hematogone samples, nine transitional B cell samples, twelve naive B cell samples, three germinal center B cell samples, nine memory B cell samples, six plasma cell samples are represented. Expression levels between different markers cannot be compared, since the measured intensity of fluorescence depends also on the specific fluorochrome bound to the antibody. HG 1: hematogones stage 1, HG 2: hematogones stage 2, TR B: transitional B cells, N B: naive B cells, GC B: germinal center B cells, M B: memory B cells, PPC: pre-plasma cells, PC: plasma cells.

References

    1. Espeli M, Rossi B, Mancini SJ, Roche P, Gauthier L, Schiff C. Initiation of pre-B cell receptor signaling: common and distinctive features in human and mouse. Semin Immunol. 2006. 18 (1): 56–66. - PubMed
    1. Perez-Andres M, Paiva B, Nieto WG, Caraux A, Schmitz A, Almeida J, et al. Human peripheral blood B-cell compartments: a crossroad in B-cell traffic. Cytometry B Clin Cytom. 2010. 78 Suppl 1: S47–60. 10.1002/cyto.b.20547 - DOI - PubMed
    1. LeBien TW, Tedder TF. B lymphocytes: how they develop and function. Blood. 2008. 112 (5): 1570–80. 10.1182/blood-2008-02-078071 - DOI - PMC - PubMed
    1. Jackson SM, Wilson PC, James J, Capra JD. Human B cell subsets. Adv Immunol. 2008. 98: 151–224. 10.1016/S0065-2776(08)00405-7 - DOI - PubMed
    1. Campana D, Janossy G, Bofill M, Trejdosiewicz LK, Ma D, Hoffbrand AV, et al. Human B cell development. I. Phenotypic differences of B lymphocytes in the bone marrow and peripheral lymphoid tissue. J Immunol. 1985. 134 (3): 1524–30. - PubMed