

MRI uncovers disrupted hippocampal microstructure that underlies memory impairments after early-life adversity
- PMID: 27657911
- PMCID: PMC5452614
- DOI: 10.1002/hipo.22661
MRI uncovers disrupted hippocampal microstructure that underlies memory impairments after early-life adversity
Abstract
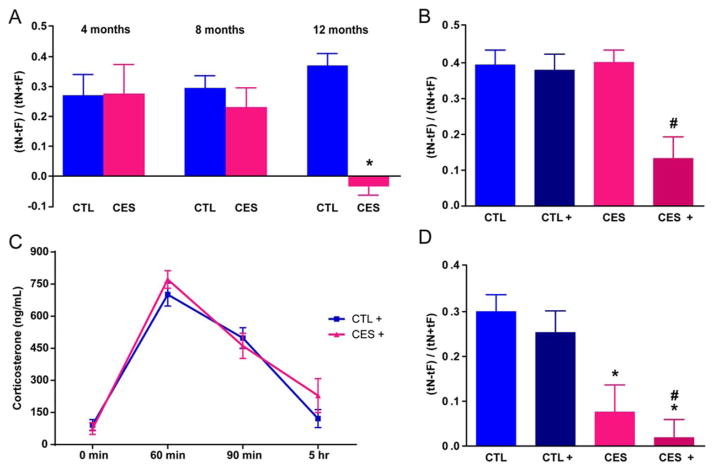
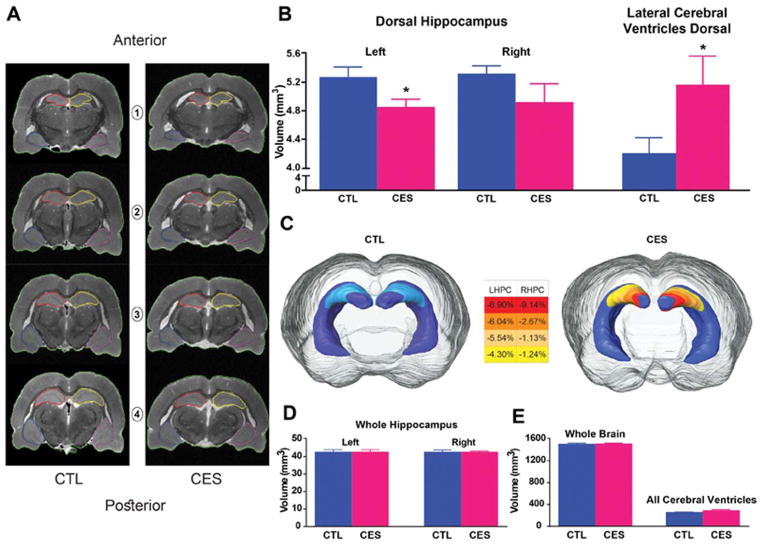
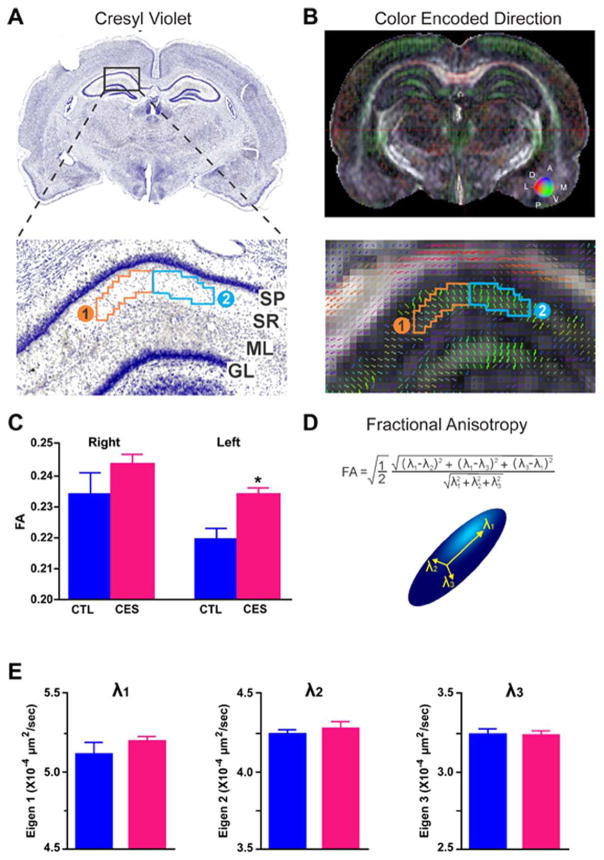
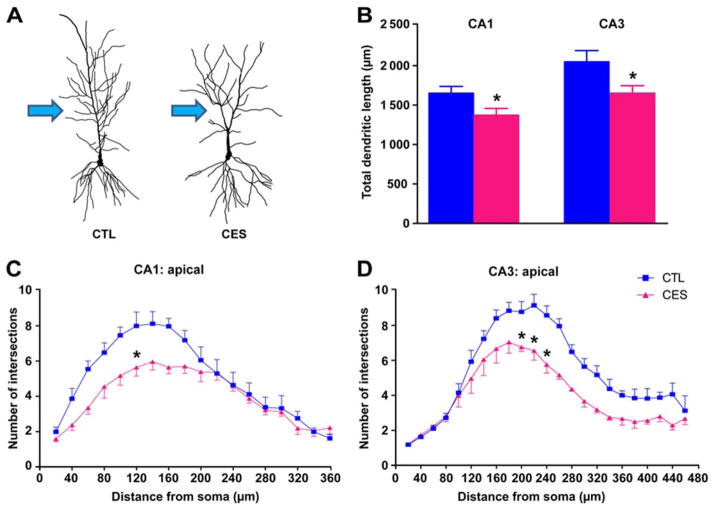
Memory and related cognitive functions are progressively impaired in a subgroup of individuals experiencing childhood adversity and stress. However, it is not possible to identify vulnerable individuals early, a crucial step for intervention. In this study, high-resolution magnetic resonance imaging (MRI) and intra-hippocampal diffusion tensor imaging (DTI) were employed to examine for structural signatures of cognitive adolescent vulnerabilities in a rodent model of early-life adversity. These methods were complemented by neuroanatomical and functional assessments of hippocampal network integrity during adolescence, adulthood and middle-age. The high-resolution MRI identified selective loss of dorsal hippocampal volume, and intra-hippocampal DTI uncovered disruption of dendritic structure, consistent with disrupted local connectivity, already during late adolescence in adversity-experiencing rats. Memory deteriorated over time, and stunting of hippocampal dendritic trees was apparent on neuroanatomical analyses. Thus, disrupted hippocampal neuronal structure and connectivity, associated with cognitive impairments, are detectable via non-invasive imaging modalities in rats experiencing early-life adversity. These high-resolution imaging approaches may constitute promising tools for prediction and assessment of at-risk individuals in the clinic. © 2016 Wiley Periodicals, Inc.
Keywords: brain networks; cognitive vulnerabilities; diffusion tensor imaging (DTI); early-life stress; magnetic resonance imaging (MRI).
© 2016 Wiley Periodicals, Inc.
Figures
Similar articles
-
Blocking CRH receptors in adults mitigates age-related memory impairments provoked by early-life adversity.Neuropsychopharmacology. 2020 Feb;45(3):515-523. doi: 10.1038/s41386-019-0562-x. Epub 2019 Nov 7. Neuropsychopharmacology. 2020. PMID: 31698409 Free PMC article.
-
Diffusion tensor imaging of the hippocampus in chronic cigarette smokers.Eur J Radiol. 2016 Sep;85(9):1538-44. doi: 10.1016/j.ejrad.2016.06.003. Epub 2016 Jun 6. Eur J Radiol. 2016. PMID: 27501886
-
Delayed effects of chronic variable stress during peripubertal-juvenile period on hippocampal morphology and on cognitive and stress axis functions in rats.Hippocampus. 2004;14(5):636-48. doi: 10.1002/hipo.10207. Hippocampus. 2004. PMID: 15301440
-
Relevance of magnetic resonance imaging for early detection and diagnosis of Alzheimer disease.Med Clin North Am. 2013 May;97(3):399-424. doi: 10.1016/j.mcna.2012.12.013. Epub 2013 Feb 1. Med Clin North Am. 2013. PMID: 23642578 Review.
-
Diffusion MRI of the Hippocampus.J Neurosci. 2024 Jun 5;44(23):e1705232024. doi: 10.1523/JNEUROSCI.1705-23.2024. J Neurosci. 2024. PMID: 38839341 Free PMC article. Review.
Cited by
-
Early life stress facilitates synapse premature unsilencing to enhance AMPA receptor function in the developing hippocampus.J Neurophysiol. 2020 Sep 1;124(3):815-821. doi: 10.1152/jn.00339.2020. Epub 2020 Aug 12. J Neurophysiol. 2020. PMID: 32783592 Free PMC article.
-
Epigenetic Changes Associated with Early Life Experiences: Saliva, A Biospecimen for DNA Methylation Signatures.Curr Genomics. 2018 Dec;19(8):676-698. doi: 10.2174/1389202919666180307150508. Curr Genomics. 2018. PMID: 30532647 Free PMC article.
-
Single-Cell Transcriptional Changes in Hypothalamic Corticotropin-Releasing Factor-Expressing Neurons After Early-Life Adversity Inform Enduring Alterations in Vulnerabilities to Stress.Biol Psychiatry Glob Open Sci. 2021 Dec 23;3(1):99-109. doi: 10.1016/j.bpsgos.2021.12.006. eCollection 2023 Jan. Biol Psychiatry Glob Open Sci. 2021. PMID: 36712559 Free PMC article.
-
Enduring disruption of reward and stress circuit activities by early-life adversity in male rats.Transl Psychiatry. 2022 Jun 16;12(1):251. doi: 10.1038/s41398-022-01988-w. Transl Psychiatry. 2022. PMID: 35705547 Free PMC article.
-
Impacts of age and environment on postnatal microglial activity: Consequences for cognitive function following early life adversity.PLoS One. 2024 Jun 25;19(6):e0306022. doi: 10.1371/journal.pone.0306022. eCollection 2024. PLoS One. 2024. PMID: 38917075 Free PMC article.
References
-
- Ayling E, Aghajani M, Fouche JP, van der Wee N. Diffusion tensor imaging in anxiety disorders. Curr Psychiatry Rep. 2012;14:197–202. - PubMed
-
- Bourgin J, Cachia A, Boumezbeur F, Djemai B, Bottlaender M, Duchesnay E, Meriaux S, Jay TM. Hyper-responsivity to stress in rats is associated with a large increase in amygdala volume. A 7T MRI study. Eur Neuropsychopharmacol J Eur Coll Neuropsychopharmacol. 2015;25:828–835. - PubMed
Publication types
MeSH terms
Substances
Grants and funding
LinkOut - more resources
Full Text Sources
Other Literature Sources
Medical
