. 2016 Sep 22;11(9):e0163256.
doi: 10.1371/journal.pone.0163256. eCollection 2016.

An MSC2 Promoter-lacZ Fusion Gene Reveals Zinc-Responsive Changes in Sites of Transcription Initiation That Occur across the Yeast Genome

Affiliations

An MSC2 Promoter-lacZ Fusion Gene Reveals Zinc-Responsive Changes in Sites of Transcription Initiation That Occur across the Yeast Genome

Yi-Hsuan Wu et al. PLoS One. .

Abstract

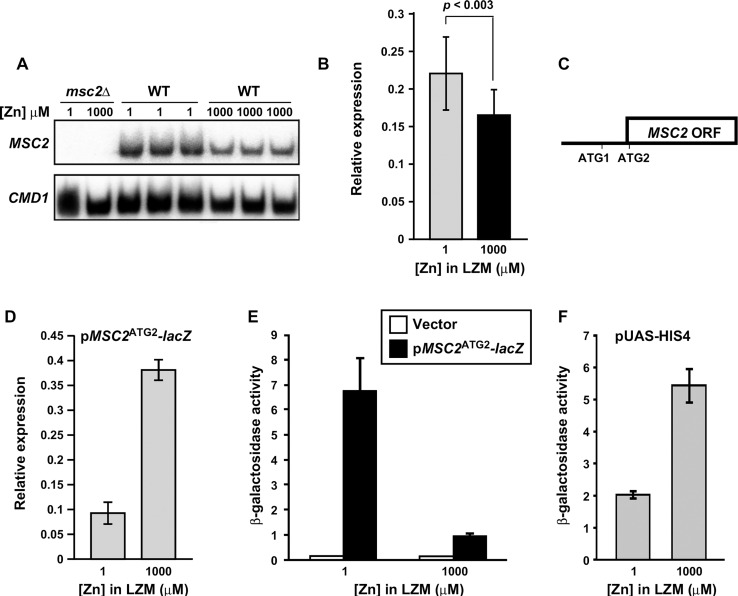
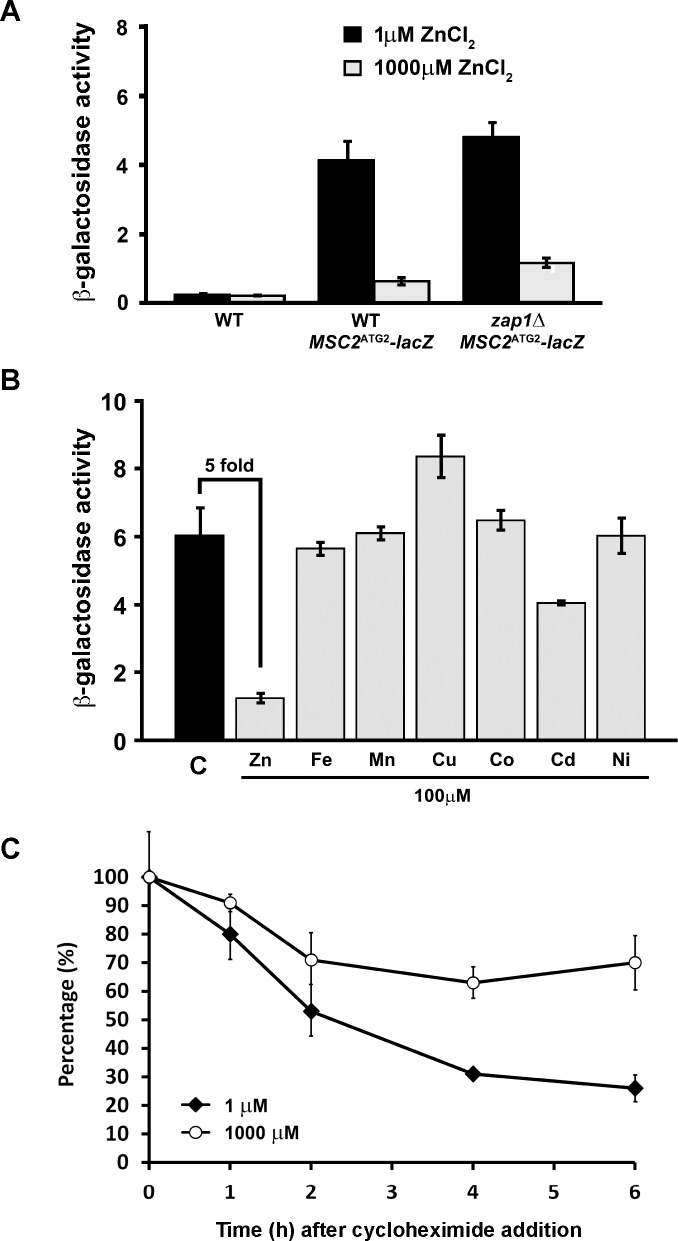
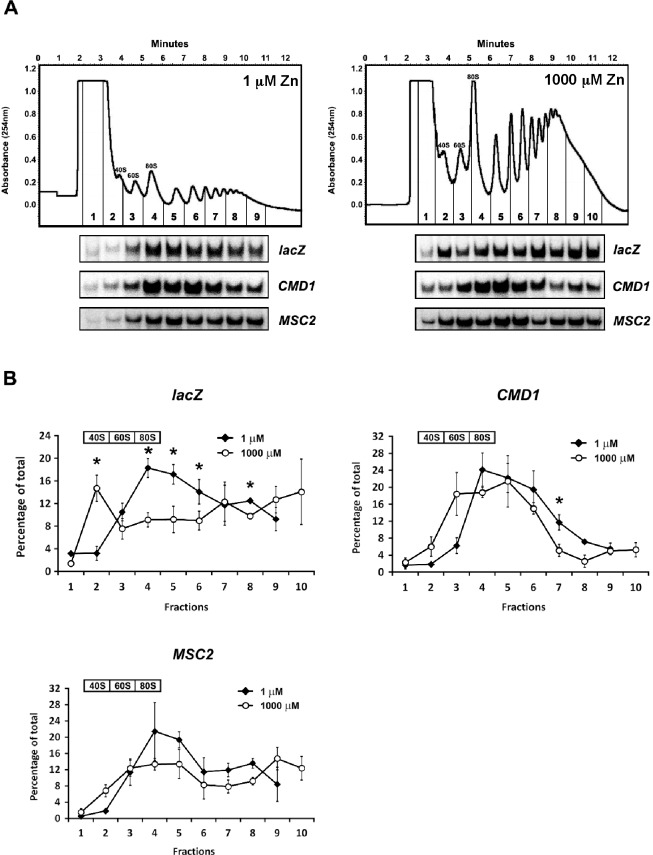
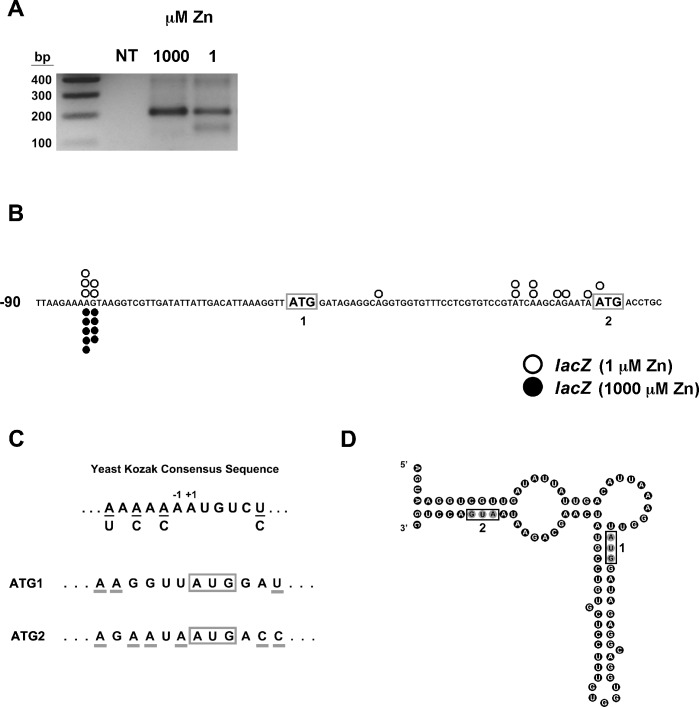
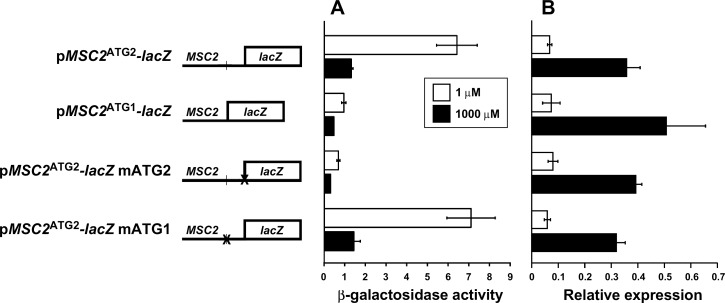
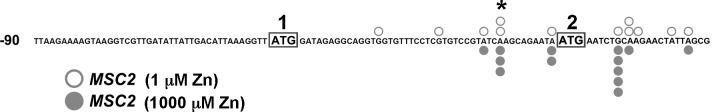
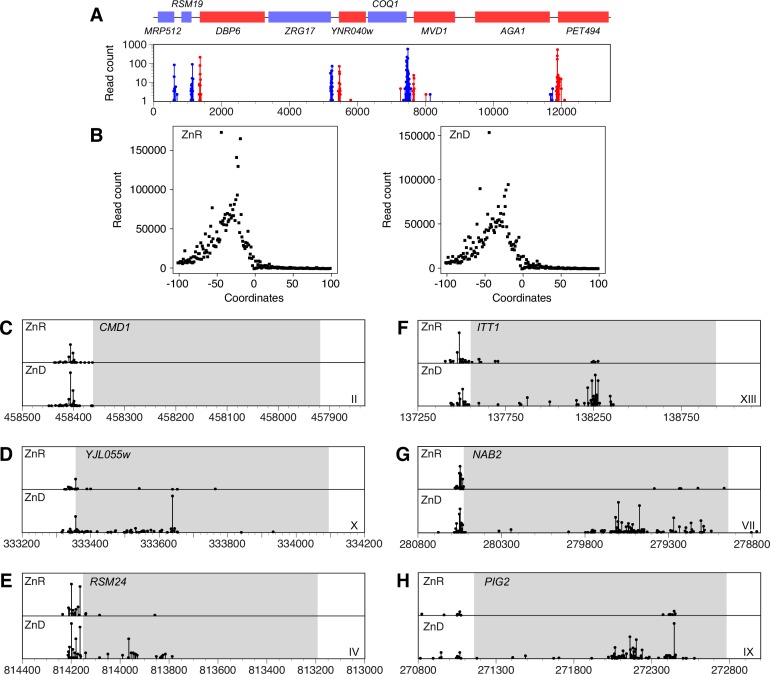
The Msc2 and Zrg17 proteins of Saccharomyces cerevisiae form a complex to transport zinc into the endoplasmic reticulum. ZRG17 is transcriptionally induced in zinc-limited cells by the Zap1 transcription factor. In this report, we show that MSC2 mRNA also increases (~1.5 fold) in zinc-limited cells. The MSC2 gene has two in-frame ATG codons at its 5' end, ATG1 and ATG2; ATG2 is the predicted initiation codon. When the MSC2 promoter was fused at ATG2 to the lacZ gene, we found that unlike the chromosomal gene this reporter showed a 4-fold decrease in lacZ mRNA in zinc-limited cells. Surprisingly, β-galactosidase activity generated by this fusion gene increased ~7 fold during zinc deficiency suggesting the influence of post-transcriptional factors. Transcription of MSC2ATG2-lacZ was found to start upstream of ATG1 in zinc-replete cells. In zinc-limited cells, transcription initiation shifted to sites just upstream of ATG2. From the results of mutational and polysome profile analyses, we propose the following explanation for these effects. In zinc-replete cells, MSC2ATG2-lacZ mRNA with long 5' UTRs fold into secondary structures that inhibit translation. In zinc-limited cells, transcripts with shorter unstructured 5' UTRs are generated that are more efficiently translated. Surprisingly, chromosomal MSC2 did not show start site shifts in response to zinc status and only shorter 5' UTRs were observed. However, the shifts that occur in the MSC2ATG2-lacZ construct led us to identify significant transcription start site changes affecting the expression of ~3% of all genes. Therefore, zinc status can profoundly alter transcription initiation across the yeast genome.


Conflict of interest statement

The authors have declared that no competing interests exist.

Figures

Fig 1
Fig 1. Effects of zinc status on chromosomal MSC2 and plasmid MSC2ATG2-lacZ expression.
A) MSC2 mRNA levels were measured by S1 nuclease protection assay of RNA isolated from msc2Δ mutant (DY150 msc2Δ) and wild-type (DY150) cells grown under zinc-limiting (LZM + 1 μM ZnCl2) or replete (LZM + 1000 μM ZnCl2) conditions. CMD1 was used as a loading control. B) The mRNA abundance of MSC2 in zinc-limited and replete DY150 cells was also determined by quantitative RT-PCR. MSC2 abundance was normalized to the average abundance of three control transcripts (18S rRNA, TAF10, and ACT1). The data plotted represent the means of fifteen replicates from each condition and the error bars denote ± 1 S.D (p <0.003 as determined by the Student’s paired t-test). C) Diagram of MSC2 with two in-frame ATGs at the 5’ end of the open reading frame indicated. ATG2 is the predicted translation start site, ATG1 is located 48 nucleotides upstream of ATG2, and the next in-frame ATG (ATG3) in the ORF is ~700 bp downstream of ATG2. Several out-of-frame ATGs are found in the interval ATG2 and ATG3. D) lacZ mRNA levels were measured by quantitative RT-PCR using RNA isolated from wild-type (DY150) cells transformed with the MSC2ATG2-lacZ reporter and grown in LZM supplemented with the indicated concentration of ZnCl2 as in panel B. The data plotted represent the means of three replicates from each condition and the error bars denote ± 1 S.D. Panels E, F) β-galactosidase activity was measured in wild-type (DY150) cells bearing the lacZ vector (YEp353), the MSC2ATG2-lacZ reporter, or a HIS4-lacZ fusion (pUAS-HIS4) grown under zinc-limiting (LZM + 1 μM ZnCl2) or replete (LZM + 1000 μM ZnCl2) conditions. Results are the means ± S.D. for three independent cultures for each condition and are representative of two independent experiments.
Fig 2
Fig 2. Zinc-responsive MSC2ATG2-lacZ activity is Zap1-independent, zinc-specific, and not due to differential degradation.
A) β-galactosidase activity was measured in wild-type (DY150) or zap1Δ mutant (ABY9) cells expressing the MSC2ATG2-lacZ reporter and grown under zinc-limiting (LZM + 1 μM ZnCl2) or replete (LZM + 1000 μM ZnCl2) conditions. Activity measured in untransformed wild-type cells was used as negative control. B) β-galactosidase activity was measured in wild-type (DY150) cells expressing the MSC2ATG2-lacZ reporter. The cells were grown under zinc-limiting conditions (LZM + 1 μM ZnCl2) either without (control, C) or with addition of 100 μM of zinc (ZnCl2), iron (FeCl3), manganese (MnCl2), copper (CuCl2), cobalt (CoCl2), cadmium (CdCl2), or nickel (NiCl2). C) β-galactosidase protein is less stable in zinc-limited cells than in replete cells. β-galactosidase activity was measured in wild-type (DY150) cells transformed with MSC2ATG2-lacZ reporter and grown under zinc-limiting (LZM + 1 μM ZnCl2) or replete (LZM + 1000 μM ZnCl2) conditions. Cycloheximide (100 μg/ml) was added to the cells at time 0 and culture aliquots were removed at the indicated times for β-galactosidase activity measurements. Data are plotted as the percentage of the activity measured at time 0. For all panels, the results plotted are the means ± S.D. for three independent cultures for each condition and are representative of two independent experiments.
Fig 3
Fig 3. Polysome profile analysis of MSC2ATG2-lacZ mRNA.
A) Representative polysome profiles of wild-type (DY150) cells expressing the MSC2ATG2-lacZ reporter and grown under zinc-limiting (LZM + 1 μM ZnCl2) or replete (LZM + 1000 μM ZnCl2) conditions. The positions of the 40S, 60S, 80S peaks are indicated and the collected fractions are numbered. RNA was extracted from each fraction and S1 nuclease protection assays were performed to detect lacZ, CMD1, and chromosomal MSC2 mRNA. B) Quantified lacZ, CMD1, and MSC2 mRNA abundance were plotted as the percentage of their total amount in all fractions. Results are the means ± S.D. for three independent cultures for each condition. The fractions containing the 40S, 60S, and 80S peaks are indicated and the asterisks indicate significant differences (p < 0.05) between zinc-replete and zinc-limited samples as determined by the paired Student’s t-test.
Fig 4
Fig 4. Zinc status affects transcription start site location in MSC2ATG2-lacZ.
A) 5’ RLM-RACE products from zinc-replete (LZM + 1000 μM ZnCl2) or zinc-limited (LZM + 1 μM ZnCl2) cells expressing MSC2ATG2-lacZ were resolved on a 2% agarose gel and stained with ethidium bromide. NT indicates a no-template PCR control and lane 1 shows DNA size markers. B) MSC2ATG2-lacZ transcription start sites in zinc-limited (LZM + 1 μM ZnCl2) and replete (LZM + 1000 μM ZnCl2) cells. 5’ RLM-RACE fragments (fourteen from zinc-limited and nine from replete cell mRNA) were independently cloned and sequenced. The open circles indicate the start sites mapped in zinc-limited cells and the filled circles indicate zinc-replete start sites. ATG1 and ATG2 are boxed and in bold. C) Comparison of sequence context around ATG1 and ATG2 of MSC2 relative to the yeast Kozak consensus sequence. The nucleotides flanking ATG1 and ATG2 that match the consensus are underlined. D) Mfold prediction of MSC2ATG2-lacZ long transcript mRNA folding. The predicated secondary structure has a Gibbs Free Energy (initial ΔG) of -24 kcal/mol. AUG1 and AUG2 are boxed.
Fig 5
Fig 5. Assessing the roles of ATG1 and ATG2 in MSC2-lacZ expression.
A) β-galactosidase activity was measured in wild-type (DY150) cells expressing MSC2ATG2-lacZ, MSC2ATG1-lacZ, MSC2ATG2-lacZ mATG2, or MSC2ATG2-lacZ mATG1 reporters and grown under zinc-limiting (LZM + 1 μM ZnCl2) or replete (LZM + 1000 μM ZnCl2) conditions. B) The lacZ mRNA abundance was also determined by quantitative RT-PCR. lacZ abundance was normalized to the average abundance of three control transcripts (18S rRNA, TAF10, and ACT1). The results are the means ± S.D. for three independent cultures for each condition.
Fig 6
Fig 6. 5’ RLM-RACE analysis of chromosomal MSC2 transcription start sites.
Mapping results of chromosomal MSC2 transcription start sites in zinc-limited (LZM + 1 μM ZnCl2) and replete (LZM + 1000 μM ZnCl2) cells. 5’ RLM-RACE fragments (twelve from zinc-limited and thirteen from replete cell mRNA) were independently cloned and sequenced. The open circles indicate zinc-limited start sites and the gray circles indicate zinc-replete start sites. ATG1 and ATG2 are boxed and in bold. The asterisk marks the major transcription start site for MSC2 mapped using mRNA from zinc-replete cells grown in rich media [25].
Fig 7
Fig 7. Mutations known to alter start site selection increase expression of the MSC2ATG2-lacZ reporter.
Panels A-C) β-galactosidase activity was measured in cells of the indicated genotypes expressing the MSC2ATG2-lacZ reporter and grown under zinc-limiting (LZM + 1 μM ZnCl2) or replete (LZM + 1000 μM ZnCl2) conditions. It should be noted that the wild-type strains used in each panel are different from each other but isogenic to the mutant strain(s) with which they are compared. D) The lacZ mRNA abundance in the cells from panel C was also determined by quantitative RT-PCR. lacZ abundance was normalized to the average abundance of three control transcripts (18S rRNA, TAF10, and ACT1). The results are the means ± S.D. for three independent cultures for each condition.
Fig 8
Fig 8. Mapping transcription start sites by 5’ Deep-RACE.
A) Transcription start sites mapped for an ~13 kb region of yeast chromosome XIV is shown. Genes indicated in red are transcribed from left to right while those in blue are transcribed from right to left. Independent sequencing reads, representing mRNA 5’ ends, are plotted with the same color scheme across the region. B) The transcription start sites mapped for all genes are plotted relative to the translation initiation codon of the open reading frame numbered as +1. Data obtained from zinc-replete and zinc-limited cells are plotted. C-H) Transcription start sites for the indicated genes are plotted relative to the open reading frame shown in gray. The chromosome of each gene is indicated by the Roman numeral and the coordinates represent the location on the corresponding chromosomes.

Similar articles

Cited by

References

    1. Wu YH, Frey AG, Eide DJ (2011) Transcriptional regulation of the Zrg17 zinc transporter of the yeast secretory pathway. Biochem J 435: 259–266. 10.1042/BJ20102003 - DOI - PMC - PubMed
    1. Eide DJ (2009) Homeostatic and Adaptive Responses to Zinc Deficiency in Saccharomyces cerevisiae. J Biol Chem 284: 18565–18569. 10.1074/jbc.R900014200 - DOI - PMC - PubMed
    1. Ellis CD, Macdiarmid CW, Eide DJ (2005) Heteromeric protein complexes mediate zinc transport into the secretory pathway of eukaryotic cells. J Biol Chem 280: 28811–28818. - PubMed
    1. Kambe T, Tsuji T, Hashimoto A, Itsumura N (2015) The Physiological, Biochemical, and Molecular Roles of Zinc Transporters in Zinc Homeostasis and Metabolism. Physiol Rev 95: 749–784. 10.1152/physrev.00035.2014 - DOI - PubMed
    1. Fukunaka A, Suzuki T, Kurokawa Y, Yamazaki T, Fujiwara N, Ishihara K, et al. (2009) Demonstration and characterization of the heterodimerization of ZnT5 and ZnT6 in the early secretory pathway. J Biol Chem 284: 30798–30806. 10.1074/jbc.M109.026435 - DOI - PMC - PubMed

LinkOut - more resources