

Separating Predicted and Perceived Sensory Consequences of Motor Learning
- PMID: 27658214
- PMCID: PMC5033392
- DOI: 10.1371/journal.pone.0163556
Separating Predicted and Perceived Sensory Consequences of Motor Learning
Erratum in
-
Correction: Separating Predicted and Perceived Sensory Consequences of Motor Learning.PLoS One. 2016 Dec 19;11(12):e0168825. doi: 10.1371/journal.pone.0168825. eCollection 2016. PLoS One. 2016. PMID: 27992603 Free PMC article.
Abstract
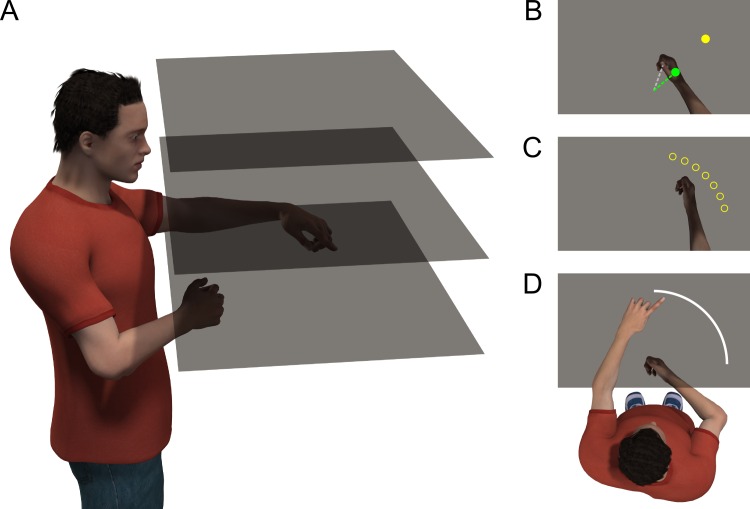
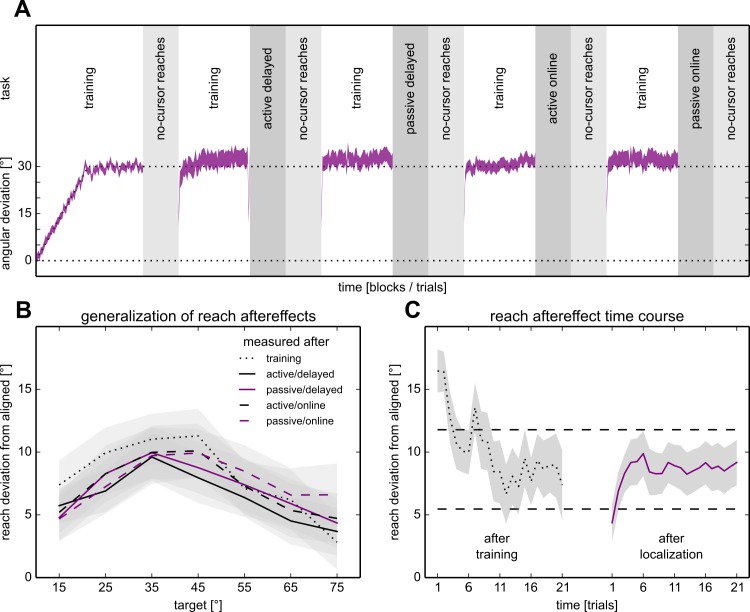
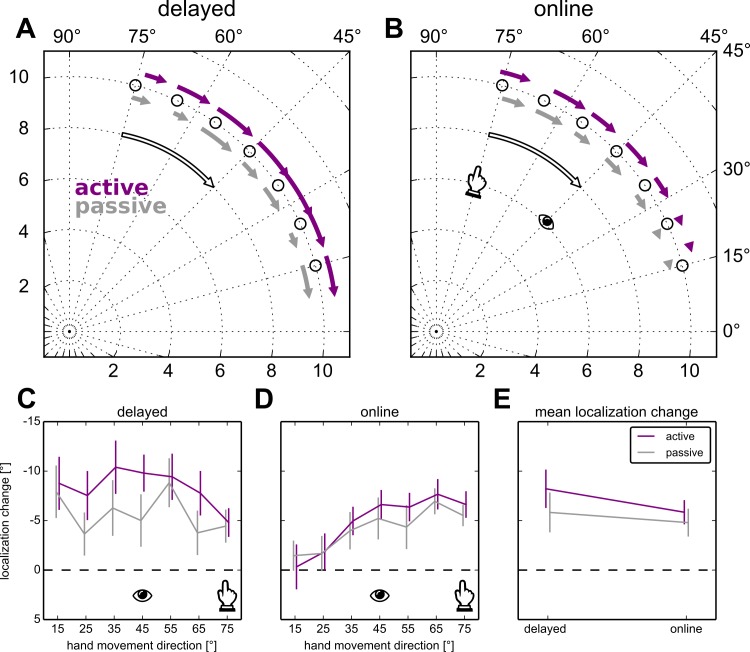
During motor adaptation the discrepancy between predicted and actually perceived sensory feedback is thought to be minimized, but it can be difficult to measure predictions of the sensory consequences of actions. Studies attempting to do so have found that self-directed, unseen hand position is mislocalized in the direction of altered visual feedback. However, our lab has shown that motor adaptation also leads to changes in perceptual estimates of hand position, even when the target hand is passively displaced. We attribute these changes to a recalibration of hand proprioception, since in the absence of a volitional movement, efferent or predictive signals are likely not involved. The goal here is to quantify the extent to which changes in hand localization reflect a change in the predicted sensory (visual) consequences or a change in the perceived (proprioceptive) consequences. We did this by comparing changes in localization produced when the hand movement was self-generated ('active localization') versus robot-generated ('passive localization') to the same locations following visuomotor adaptation to a rotated cursor. In this passive version, there should be no predicted consequences of these robot-generated hand movements. We found that although changes in localization were somewhat larger in active localization, the passive localization task also elicited substantial changes. Our results suggest that the change in hand localization following visuomotor adaptation may not be based entirely on updating predicted sensory consequences, but may largely reflect changes in our proprioceptive state estimate.
Conflict of interest statement
The authors have declared that no competing interests exist.
Figures
Similar articles
-
Motor learning without moving: Proprioceptive and predictive hand localization after passive visuoproprioceptive discrepancy training.PLoS One. 2019 Aug 29;14(8):e0221861. doi: 10.1371/journal.pone.0221861. eCollection 2019. PLoS One. 2019. PMID: 31465524 Free PMC article.
-
The effect of visuomotor adaptation on proprioceptive localization: the contributions of perceptual and motor changes.Exp Brain Res. 2014 Jul;232(7):2073-86. doi: 10.1007/s00221-014-3896-y. Epub 2014 Mar 13. Exp Brain Res. 2014. PMID: 24623356
-
The role of the cross-sensory error signal in visuomotor adaptation.Exp Brain Res. 2013 Jul;228(3):313-25. doi: 10.1007/s00221-013-3564-7. Epub 2013 May 26. Exp Brain Res. 2013. PMID: 23708802 Clinical Trial.
-
Reach adaptation and proprioceptive recalibration following exposure to misaligned sensory input.J Neurophysiol. 2010 Apr;103(4):1888-95. doi: 10.1152/jn.01002.2009. Epub 2010 Feb 3. J Neurophysiol. 2010. PMID: 20130036 Clinical Trial.
-
Visuomotor adaptation and proprioceptive recalibration.J Mot Behav. 2012;44(6):435-44. doi: 10.1080/00222895.2012.659232. J Mot Behav. 2012. PMID: 23237466 Review.
Cited by
-
Distinct learning, retention, and generalization patterns in de novo learning versus motor adaptation.Sci Rep. 2024 Apr 17;14(1):8906. doi: 10.1038/s41598-024-59445-1. Sci Rep. 2024. PMID: 38632252 Free PMC article.
-
Individual differences in proprioception predict the extent of implicit sensorimotor adaptation.J Neurophysiol. 2021 Apr 1;125(4):1307-1321. doi: 10.1152/jn.00585.2020. Epub 2021 Mar 3. J Neurophysiol. 2021. PMID: 33656948 Free PMC article.
-
Evidence for an efferent-based prediction contributing to implicit motor adaptation.PLoS One. 2025 Apr 29;20(4):e0322627. doi: 10.1371/journal.pone.0322627. eCollection 2025. PLoS One. 2025. PMID: 40299963 Free PMC article.
-
Perceptual error based on Bayesian cue combination drives implicit motor adaptation.Elife. 2024 Jul 4;13:RP94608. doi: 10.7554/eLife.94608. Elife. 2024. PMID: 38963410 Free PMC article.
-
Correction: Separating Predicted and Perceived Sensory Consequences of Motor Learning.PLoS One. 2016 Dec 19;11(12):e0168825. doi: 10.1371/journal.pone.0168825. eCollection 2016. PLoS One. 2016. PMID: 27992603 Free PMC article.
References
-
- Tseng Y-w, Diedrichsen J, Krakauer JW, Shadmehr R, Bastian AJ (2007) Sensory prediction errors drive cerebellum-dependent adaptations of reaching. J Neurophysiol 98(1): 54–62. - PubMed
LinkOut - more resources
Full Text Sources
Other Literature Sources
Miscellaneous
