. 2016 Sep 23:6:34027.
doi: 10.1038/srep34027.

Flavonoids are determinants of freezing tolerance and cold acclimation in Arabidopsis thaliana

Affiliations

Flavonoids are determinants of freezing tolerance and cold acclimation in Arabidopsis thaliana

Elisa Schulz et al. Sci Rep. .

Abstract

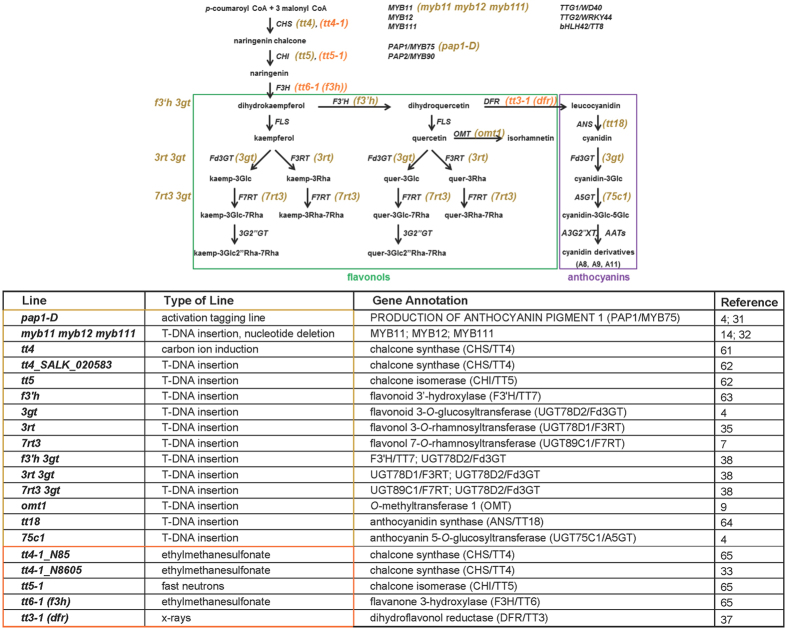
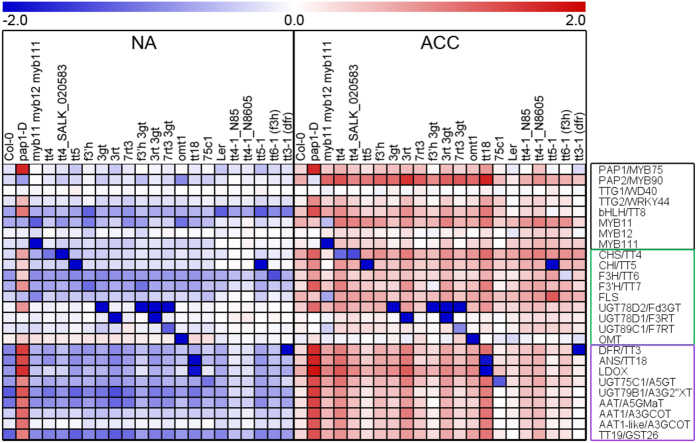
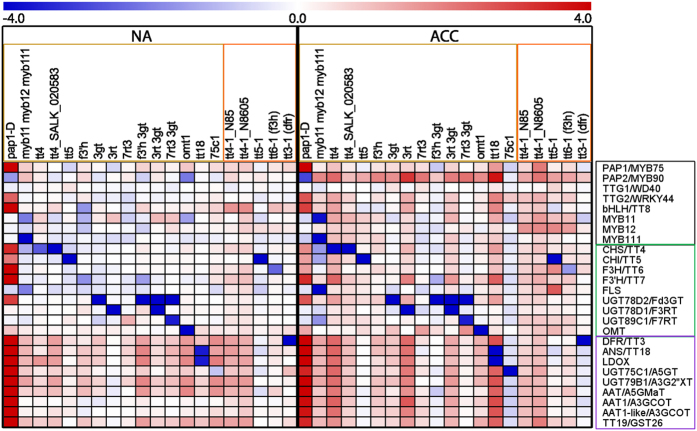
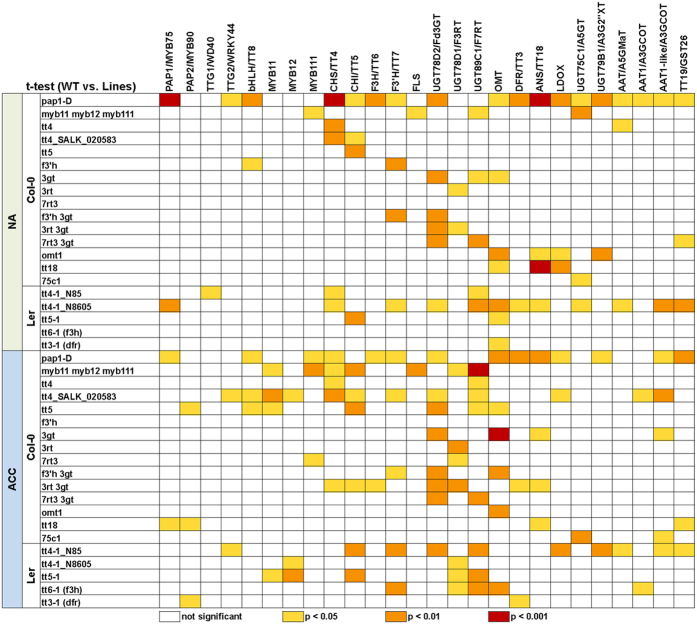
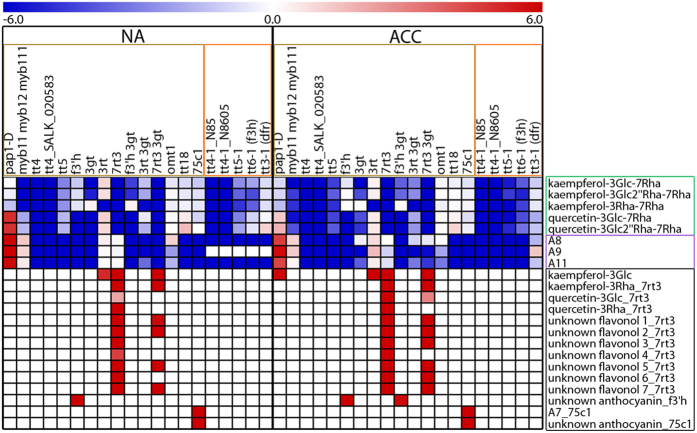
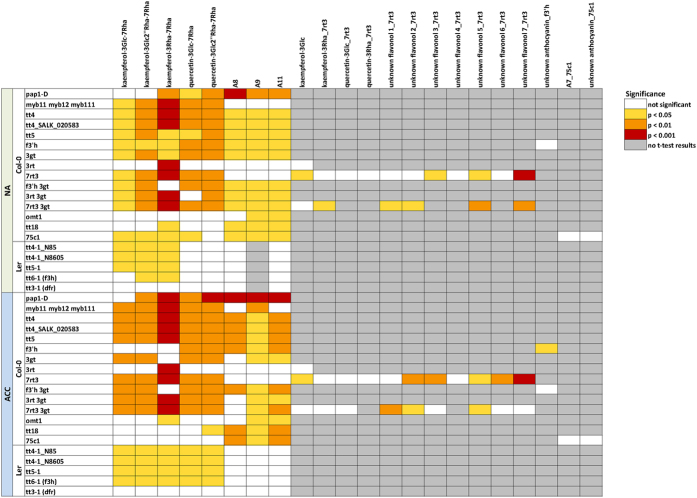
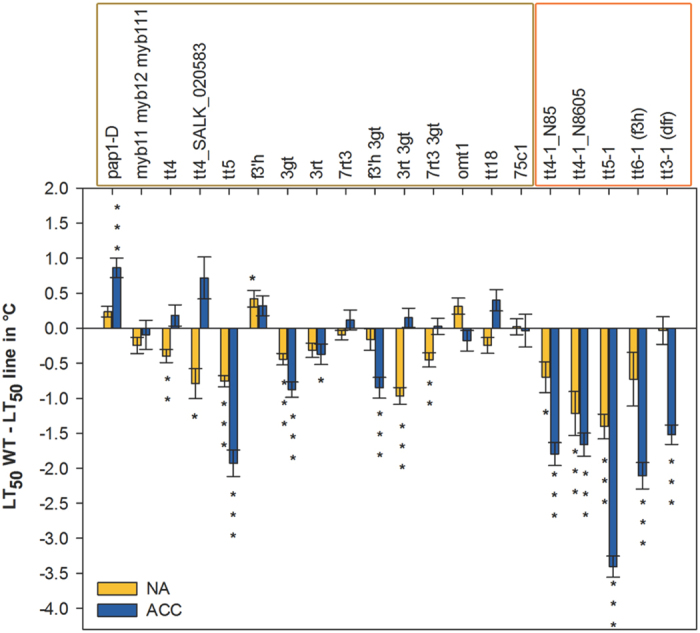
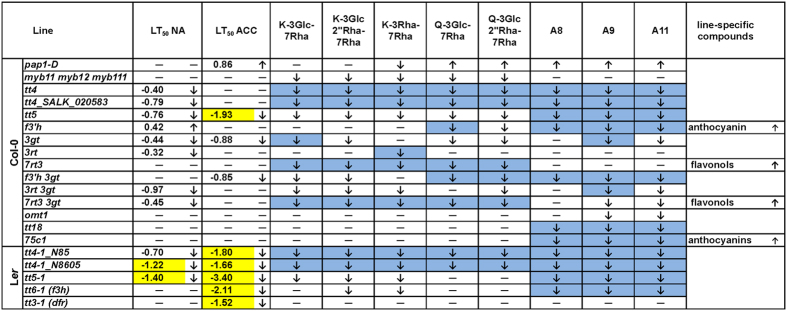
In plants from temperate climates such as Arabidopsis thaliana low, non-freezing temperatures lead to increased freezing tolerance in a process termed cold acclimation. This process is accompanied by massive changes in gene expression and in the content of primary metabolites and lipids. In addition, most flavonols and anthocyanins accumulate upon cold exposure, along with most transcripts encoding transcription factors and enzymes of the flavonoid biosynthetic pathway. However, no evidence for a functional role of flavonoids in plant freezing tolerance has been shown. Here, we present a comprehensive analysis using qRT-PCR for transcript, LC-MS for flavonoid and GC-MS for primary metabolite measurements, and an electrolyte leakage assay to determine freezing tolerance of 20 mutant lines in two Arabidopsis accessions that are affected in different steps of the flavonoid biosynthetic pathway. This analysis provides evidence for a functional role of flavonoids in plant cold acclimation. The accumulation of flavonoids in the activation tagging mutant line pap1-D improved, while reduced flavonoid content in different knock-out mutants impaired leaf freezing tolerance. Analysis of the different knock-out mutants suggests redundancy of flavonoid structures, as the lack of flavonols or anthocyanins could be compensated by other compound classes.


Figures

Figure 1
Figure 1. Flavonol and anthocyanin biosynthetic pathway indicating mutant lines used in this study.
Genes and metabolites are shown in black, mutant lines in Col-0 background in yellow and in Ler background in orange. Details of the mutant lines are listed in the bottom panel. MYB11, MYB12, MYB111, R2R3 MYB transcription factors; TTG1/WD40, TTG2/WRKY44, transparent testa glabra; bHLH42/TT8, basic helix-loop-helix protein 42; PAP1/MYB75, PAP2/MYB90, production of anthocyanin pigment proteins 1 and 2; CHS/TT4, chalcone synthase; CHI/TT5, chalcone isomerase; F3H/TT6, flavanone 3-hydroxylase; F3′H/TT7, flavonoid 3′-hydroxylase; FLS, flavonol synthase; OMT1, O-methyltransferase 1; DFR/TT3, dihydroflavonol 4-reductase; ANS/TT18, anthocyanidin synthase; UGT78D2/Fd3GT, UGT78D1/F3RT, UGT89C1/F7RT, UGT75C1/A5GT, A3G2″XT, UDP-glucoronosyl/UDP-glucosyl transferase family proteins; AAT, anthocyanin acyl-transferase; TT, transparent testa.
Figure 2
Figure 2. Relative transcript abundance (2−ΔCt) of flavonoid biosynthesis genes in mutant lines and the corresponding wild types under non-acclimated (NA) and cold acclimated (ACC) conditions.
Mutant lines are sorted according to their positions in the flavonoid biosynthetic pathway. Data represent averages of three biological replicates per line and condition, log10 median transformed over all lines and both conditions for every gene with transcript abundance above median in red and below median in blue, as indicated by the scale bar. Genes encoding transcription factors are framed in black, flavonol biosynthesis genes in green and anthocyanin biosynthesis genes in purple (see also Suppl. Table 1).
Figure 3
Figure 3. Log2 fold change of relative transcript abundance (2−ΔCt) of flavonoid biosynthesis genes in mutant lines relative to Col-0 or Ler wild type under non-acclimated (NA) and cold acclimated (ACC) conditions.
Mutant lines in Col-0 (yellow framed) and Ler (orange framed) are sorted according to their positions in the flavonoid biosynthetic pathway. Data represent averages of three biological replicates per line and condition with higher relative expression in mutant lines compared to wild type in red and lower expression in blue, as indicated by the scale bar. Genes encoding TFs are framed in black, flavonol biosynthesis genes in green and anthocyanin biosynthesis genes in purple (see also Suppl. Table 1).
Figure 4
Figure 4. Statistical analysis of gene expression data (log2-fold change) shown inFig. 3.
t-tests (two-sided with unequal variance) were used to determine the significance of expression changes between mutant lines and their wild types Col-0 or Ler under non-acclimated (NA) and acclimated condition (ACC). p-values were corrected using the Benjamini-Hochberg procedure and color coded as indicated in the figure (see also Suppl. Table 4).
Figure 5
Figure 5. Flavonoid content (relative peak area) in mutant lines changed in flavonoid metabolism under non-acclimated (NA) and acclimated (ACC) conditions.
Mutant lines in Col-0 (yellow framed) and Ler (orange framed) are sorted according to their positions in the flavonoid biosynthetic pathway. Data represent averages of three or six (only Col-0 wild type and single mutants) biological replicates with higher flavonoid content in mutant lines in comparison to corresponding wild type in red and lower content in blue, as indicated by the scale bar. Central flavonols and anthocyanins are framed in green and purple, minor flavonoids and flavonols with unknown structure in black (see also Suppl. Table 2).
Figure 6
Figure 6. Statistical analysis of differences in flavonoid content between mutant lines and their wild types Col-0 or Ler under non-acclimated (NA) and acclimated condition (ACC).
t-tests (two-sided with unequal variance) were used to determine the significance of expression changes. p-values were corrected using the Benjamini-Hochberg procedure and color coded as indicated in the figure. Gray fields indicate that no t-test could be performed because the metabolite was undetectable in these samples (see also Suppl. Table 5).
Figure 7
Figure 7. Freezing tolerance of all mutant lines (see Fig. 1) compared to the corresponding wild types, of non-acclimated and cold acclimated plants.
Mutant lines in Col-0 (framed in yellow) and Ler (framed in orange) are sorted according to their position in the flavonoid biosynthetic pathway. The bars indicate the differences in leaf freezing tolerance between wild type and mutant expressed as LT50 (temperature at which 50% electrolyte leakage occurred). Positive values indicate improved freezing tolerance, negative values impaired freezing tolerance compared to the respective wild type. Data are means from two to four independent plant cultures, each with four biological replicates per line and condition. Significant differences, evaluated by Welch’s unpaired t-test, are marked by asterisks: *p < 0.05, **p < 0.01, ***p < 0.001.
Figure 8
Figure 8. Overview of the effects of all investigated mutations on non-acclimated (LT50 NA) and acclimated freezing tolerance (LT50 ACC) and on flavonoid content.
Significantly changed LT50 values are shown (LT50 wild type – LT50 mutant) and decrease (↓), increase (↑), and no changes (—) are indicated. Changes in LT50 of more than 1 °C are highlighted in yellow. Significantly decreased (↓) or increased (↑) contents of kaempferols (K), quercetins (Q), anthocyanins (A) and mutant-specific flavonoids are indicated for both NA and ACC conditions combined. Complete absence of a compound is indicated in blue.

Similar articles

Cited by

References

    1. Buer C. S., Imin N. & Djordjevic M. A. Flavonoids: new roles for old molecules. J. Integr. Plant Biol. 52, 98–111 (2010). - PubMed
    1. Winkel-Shirley B. Flavonoid biosynthesis. A colorful model for genetics, biochemistry, cell biology, and biotechnology. Plant Physiol. 126, 485–493 (2001). - PMC - PubMed
    1. Stobiecki M. A. et al.. Profiling of phenolic glycosidic conjugates in leaves of Arabidopsis thaliana using LC/MS. Metabolomics, 197–219 (2006).
    1. Tohge T. et al.. Functional genomics by integrated analysis of metabolome and transcriptome of Arabidopsis plants over-expressing an MYB transcription factor. Plant J. 42, 218–235 (2005). - PubMed
    1. Veit M. & Pauli G. F. Major flavonoids from Arabidopsis thaliana leaves. J. Nat. Prod. 62, 1301–1303 (1999). - PubMed

LinkOut - more resources