Comparative Study
. 2016 Oct;29(10):1486-96.
doi: 10.1002/nbm.3598.

Comparison of spoiled gradient echo and steady-state free-precession imaging for native myocardial T1 mapping using the slice-interleaved T1 mapping (STONE) sequence

Affiliations
Comparative Study

Comparison of spoiled gradient echo and steady-state free-precession imaging for native myocardial T1 mapping using the slice-interleaved T1 mapping (STONE) sequence

Jihye Jang et al. NMR Biomed. 2016 Oct.

Abstract

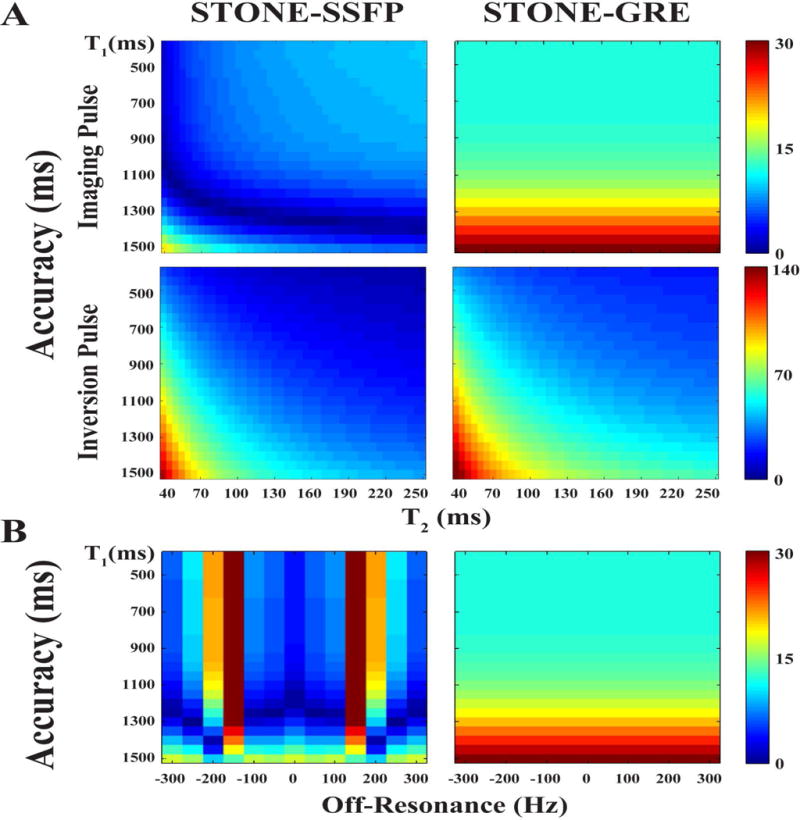
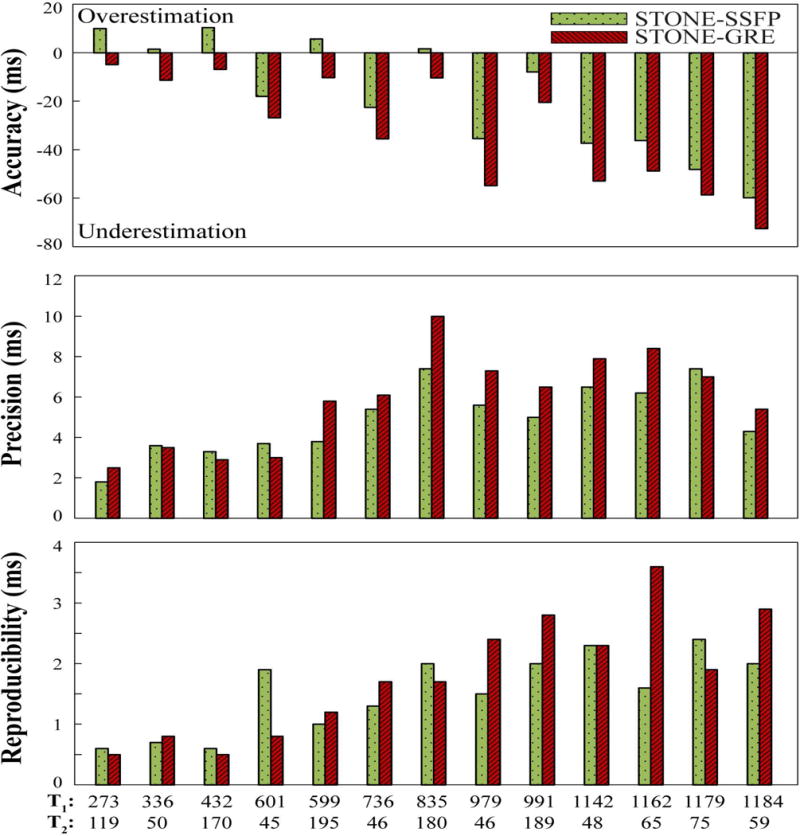
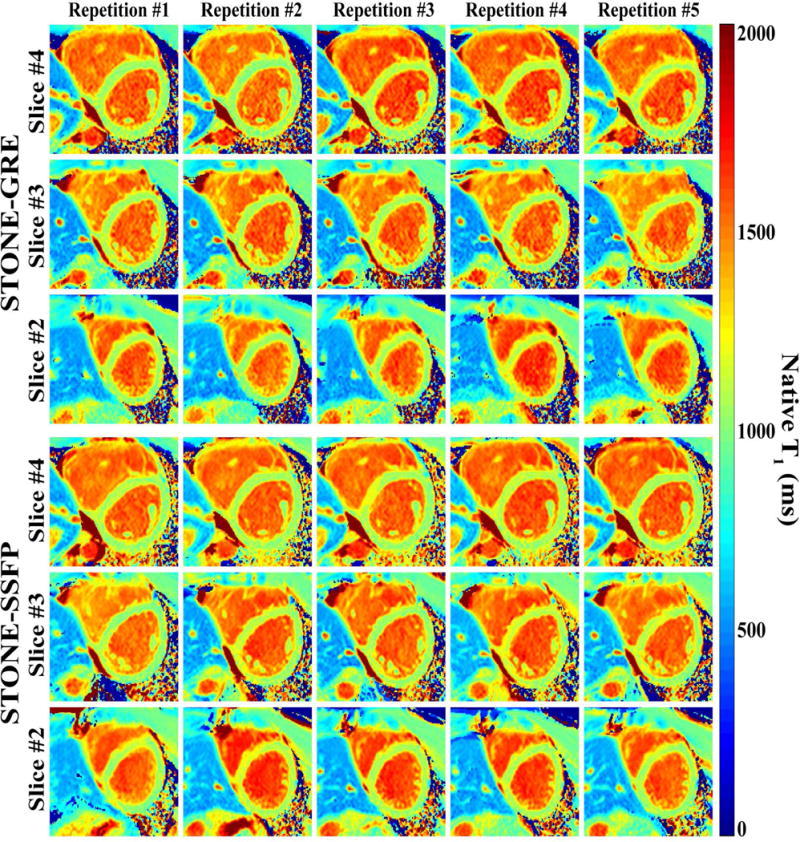
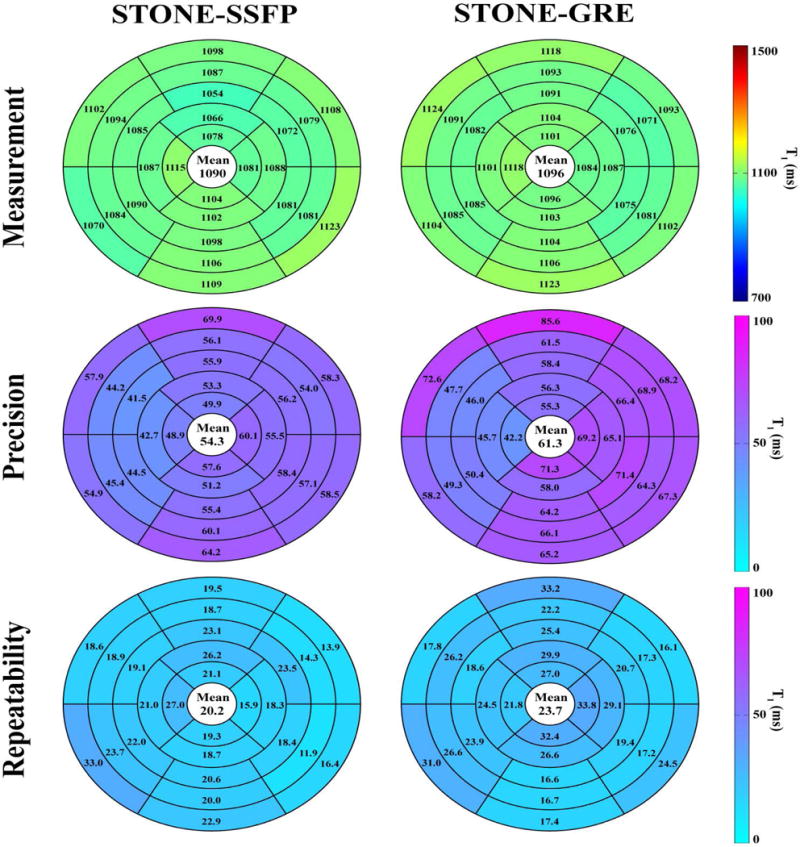
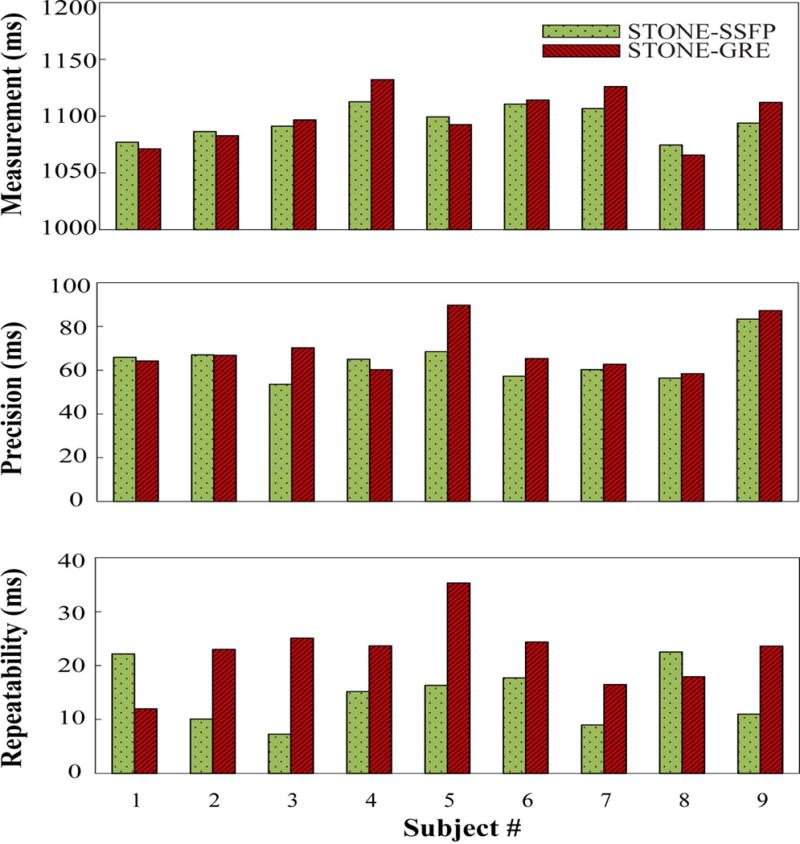
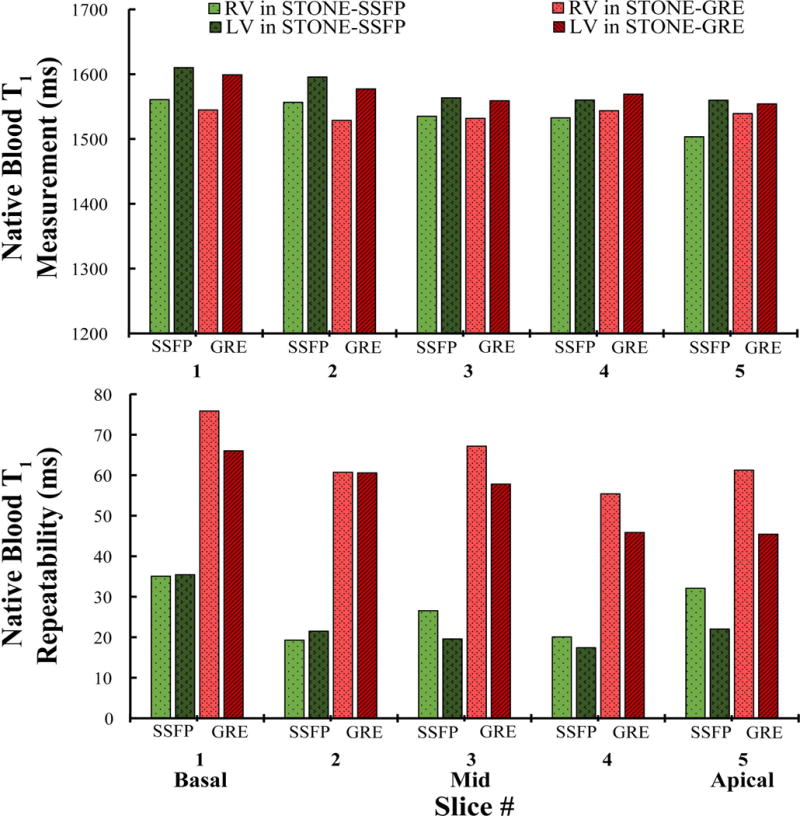
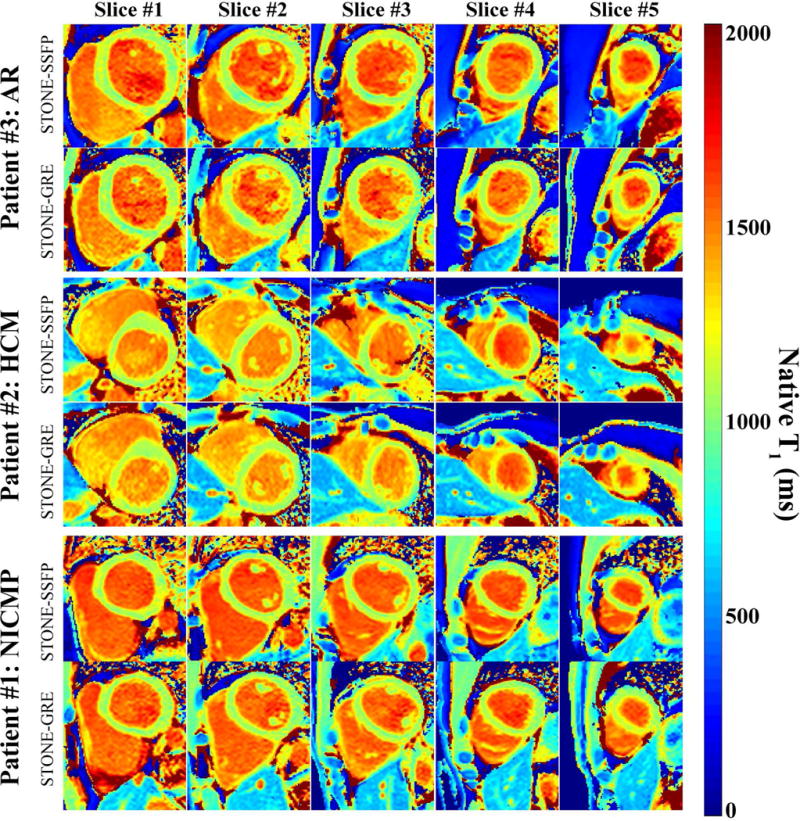
Cardiac T1 mapping allows non-invasive imaging of interstitial diffuse fibrosis. Myocardial T1 is commonly calculated by voxel-wise fitting of the images acquired using balanced steady-state free precession (SSFP) after an inversion pulse. However, SSFP imaging is sensitive to B1 and B0 imperfection, which may result in additional artifacts. A gradient echo (GRE) imaging sequence has been used for myocardial T1 mapping; however, its use has been limited to higher magnetic field to compensate for the lower signal-to-noise ratio (SNR) of GRE versus SSFP imaging. A slice-interleaved T1 mapping (STONE) sequence with SSFP readout (STONE-SSFP) has been recently proposed for native myocardial T1 mapping, which allows longer recovery of magnetization (>8 R-R) after each inversion pulse. In this study, we hypothesize that a longer recovery allows higher SNR and enables native myocardial T1 mapping using STONE with GRE imaging readout (STONE-GRE) at 1.5T. Numerical simulations and phantom and in vivo imaging were performed to compare the performance of STONE-GRE and STONE-SSFP for native myocardial T1 mapping at 1.5T. In numerical simulations, STONE-SSFP shows sensitivity to both T2 and off resonance. Despite the insensitivity of GRE imaging to T2 , STONE-GRE remains sensitive to T2 due to the dependence of the inversion pulse performance on T2 . In the phantom study, STONE-GRE had inferior accuracy and precision and similar repeatability as compared with STONE-SSFP. In in vivo studies, STONE-GRE and STONE-SSFP had similar myocardial native T1 times, precisions, repeatabilities and subjective T1 map qualities. Despite the lower SNR of the GRE imaging readout compared with SSFP, STONE-GRE provides similar native myocardial T1 measurements, precision, repeatability, and subjective image quality when compared with STONE-SSFP at 1.5T.

Keywords: balanced steady-state free precession; cardiovascular MR (CMR) methods; myocardial T1 mapping; relaxometry; slice-interleaved T1 mapping; spoiled gradient echo.


Figures

Figure 1
Figure 1
Accuracy of T1 measurements (i.e. differences between actual and estimated T1 in ms) obtained in numerical simulations as a function of T2 times (A) and off-resonance (B) for STONE-SSFP (left column) and STONE-GRE (right column).
Figure 2
Figure 2
Accuracy, precision and repeatability of STONE-GRE and STONE-SSFP obtained in the phantom with 13 vials with different T1/T2 values. Accuracy was defined as the difference between the averaged T1 times over all 15 repetitions and the spin echo T1 measurements. Precision was defined as the average over all 15 repetitions of the T1 standard deviation within each vial. Repeatability was defined as the standard deviation over all 15 repetitions of the mean T1 times within each vial.
Figure 3
Figure 3
Example native T1 map and corresponding T1-weighted images obtained in one subject using STONE-GRE (top) and STONE-SSFP (bottom) sequence. Inversion time (TI) of selected T1-weighted images were 350ms, 1 RR + 350ms, 2 RR + 350ms, 3 RR + 350ms, and Infinity from left to right (RR: the interval time between two R-waves).
Figure 4
Figure 4
Example of native T1 maps obtained in one subject using the STONE-GRE (top) and the STONE-SSFP (bottom) sequence. T1 maps are shown for the three mid-ventricular slices and five repetitions of each sequence. All T1 maps show homogeneous T1 signal over the entire myocardium, slices, and repetitions.
Figure 5
Figure 5
Measurement, precision, and repeatability of STONE-GRE and STONE-SSFP native myocardial T1 over all nine healthy subjects using a myocardial segment model based analysis. Precision was defined as the average over the five repeated scans of the standard deviation of T1 times over each segment. Repeatability was defined as the standard deviation over the five repeated scans of the average T1 times in each segment. STONE-GRE and STONE-SSFP provided similar measurements (STONE-GRE: 1096±15 ms, STONE-SSFP: 1090±16 ms), precision (STONE-GRE: 61±10 ms, STONE-SSFP: 54±7 ms) and repeatability (STONE-GRE: 24±6 ms, STONE-SSFP: 20±4 ms).
Figure 6
Figure 6
Global myocardial T1 measurements (top panel), precision (middle panel), and repeatability (bottom panel) of STONE-GRE and STONE-SSFP for each individual subject, measured over the entire five slices. There were no statistical differences between the STONE-GRE and STONE-SSFP sequences in term of measurements (STONE-GRE: 1099±24 ms, STONE-SSFP: 1095±14 ms, p>0.05), precision (STONE-GRE: 69±11 ms, STONE-SSFP: 64±9 ms, p>0.05) and repeatability (STONE-GRE: 22±7 ms, STONE-SSFP: 15±6 ms, p>0.05).
Figure 7
Figure 7
Measurement and repeatability of STONE-GRE and STONE-SSFP native blood T1 in the right and left ventricle (RV/LV). Repeatability was defined as the standard deviation (over the five repetition scans) of the average T1 measurements of blood in each slice (5 slices: 1-basal; 2-mid-basal; 3-mid-cavity; 4-mid-apical; 5-apical). STONE-GRE provided similar native blood T1 measurement (RV: 1537±106 ms vs. 1535±80 ms, p>0.05, LV: 1572±104 ms vs. 1578±85 ms, p>0.05) and inferior repeatability (RV: 64.11±7.78 vs. 26.64±7.04, p=0.008, LV: 55.18±9.15 vs. 23.23±7.08, p=0.004) compared to STONE-SSFP.
Figure 8
Figure 8
Example native T1 maps obtained with STONE-GRE and STONE-SSFP in patients (patient #1: Non-ischemic cardiomyopathy (NICMP), patient #2: hypertrophic cardiomyopathy (HCM), patient #3: aortic regurgitation (AR)). Both sequences resulted in similar native T1 time (STONE-GRE: 1107±34 ms vs. STONE-SSFP: 1110±31 ms) and were well correlated (r=0.86, p<0.001).

Similar articles

Cited by

References

    1. Messroghli DR, Niendorf T, Schulz-Menger J, Dietz R, Friedrich MG. T1 mapping in patients with acute myocardial infarction. J Cardiovasc Magn Reson. 2003;5(2):353–359. - PubMed
    1. Messroghli DR, Radjenovic A, Kozerke S, Higgins DM, Sivananthan MU, Ridgway JP. Modified Look-Locker inversion recovery (MOLLI) for high-resolution T1 mapping of the heart. Magn Reson Med. 2004;52(1):141–146. - PubMed
    1. Piechnik SK, Ferreira VM, Dall’Armellina E, Cochlin LE, Greiser A, Neubauer S, Robson MD. Shortened Modified Look-Locker Inversion recovery (ShMOLLI) for clinical myocardial T1-mapping at 1.5 and 3 T within a 9 heartbeat breathhold. J Cardiovasc Magn Reson. 2010;12:69. - PMC - PubMed
    1. Chow K, Flewitt JA, Green JD, Pagano JJ, Friedrich MG, Thompson RB. Saturation recovery single-shot acquisition (SASHA) for myocardial T(1) mapping. Magn Reson Med. 2014;71(6):2082–2095. - PubMed
    1. Weingärtner S, Akcakaya M, Basha T, Kissinger KV, Goddu B, Berg S, Manning WJ, Nezafat R. Combined saturation/inversion recovery sequences for improved evaluation of scar and diffuse fibrosis in patients with arrhythmia or heart rate variability. Magn Reson Med. 2014;71(3):1024–1034. - PubMed

LinkOut - more resources