. 2016 Sep 23:6:33564.
doi: 10.1038/srep33564.

Toll-Like Receptor 9 Activation Rescues Impaired Antibody Response in Needle-free Intradermal DNA Vaccination

Affiliations

Toll-Like Receptor 9 Activation Rescues Impaired Antibody Response in Needle-free Intradermal DNA Vaccination

Prabhu S Arunachalam et al. Sci Rep. .

Abstract

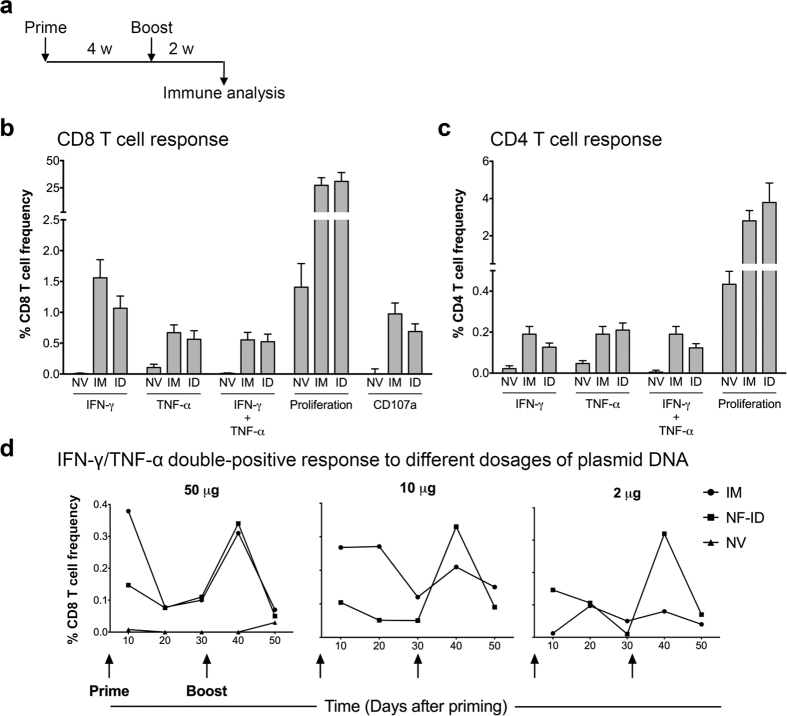
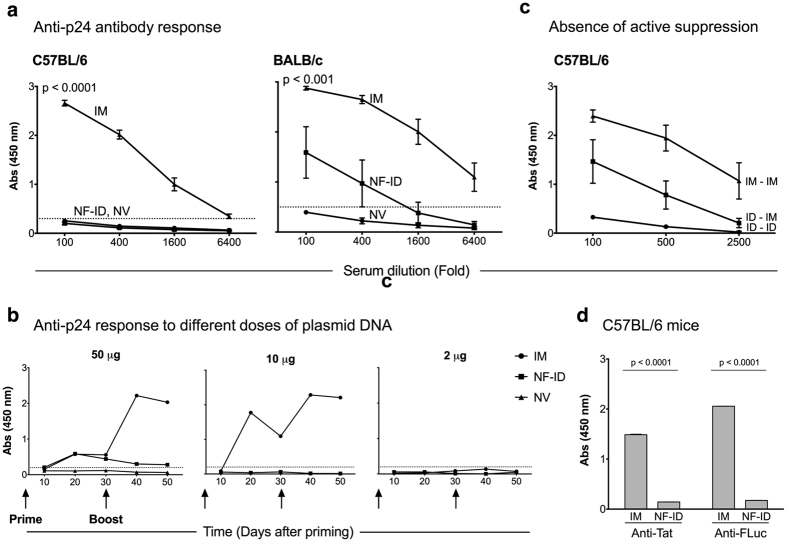
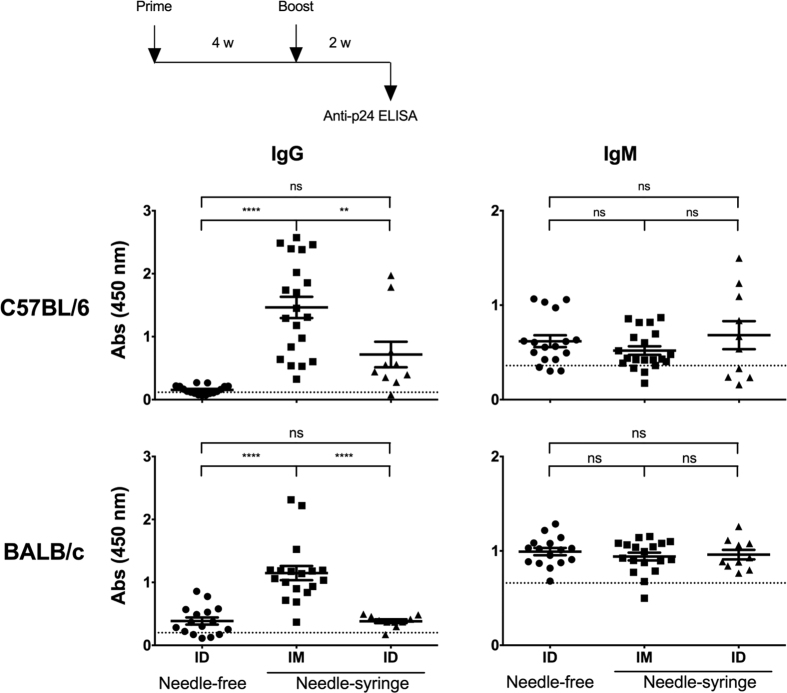
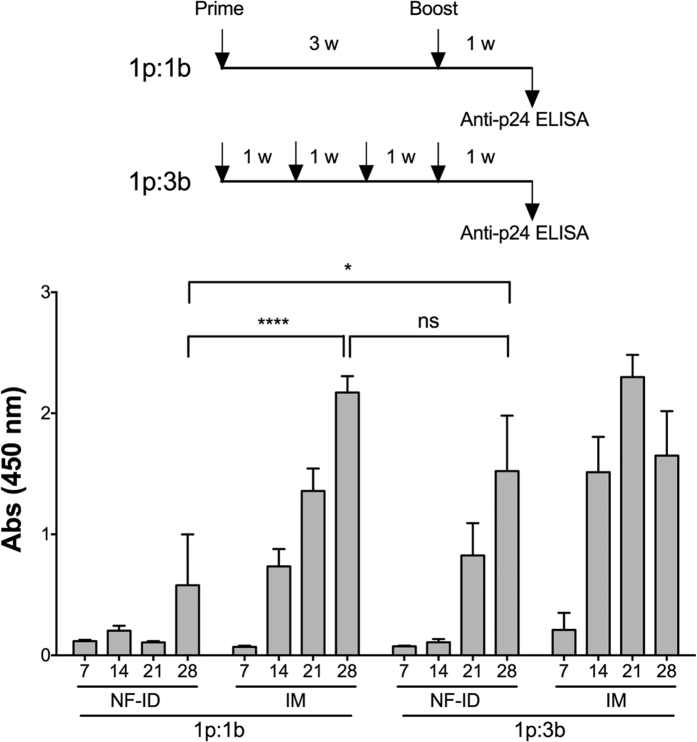
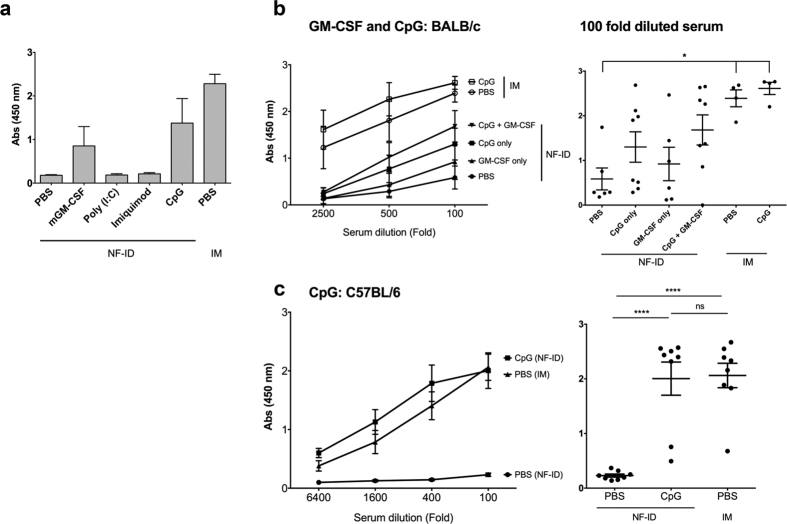
The delivery of plasmid DNA to the skin can target distinct subsets of dermal dendritic cells to confer a superior immune response. The needle-free immunization technology offers a reliable, safe and efficient means to administer intradermal (ID) injections. We report here that the ID injection of DNA vectors using an NF device (NF-ID) elicits a superior cell-mediated immune response, at much lesser DNA dosage, comparable in magnitude to the traditional intramuscular immunization. However, the humoral response is significantly impaired, possibly at the stage of B cell isotype switching. We found that the NF-ID administration deposits the DNA primarily on the epidermis resulting in a rapid loss of the DNA as well as the synthesized antigen due to the faster regeneration rate of the skin layers. Therefore, despite the immune-rich nature of the skin, the NF-ID immunization of DNA vectors may be limited by the impaired humoral response. Additional booster injections are required to augment the antibody response. As an alternative and a viable solution, we rescued the IgG response by coadministration of a Toll-like receptor 9 agonist, among other adjuvants examined. Our work has important implication for the optimization of the emerging needle-free technology for ID immunization.


Figures

Figure 1
Figure 1. Comparable magnitude of cell-mediated immune responses elicited by the IM and NF-ID immunizations.
(a) A line diagram showing the immunization schematic. Groups of female C57BL/6 mice were immunized with 50 μg null vector (NV) or pCMV-Gag vector. The null vector was administered through the IM route and the pCMV-Gag vector through the IM or NF-ID route. Two weeks after a booster injection, the splenocytes were harvested and subjected to the ICS, CD107a degranulation and CFSE dilution assays. The percentage frequencies of the CD8 (b) and CD4 (c) T cells manifesting the phenotypes depicted are plotted (mean ± SEM). The data are obtained from three independent experiments with four mice each per group. Unpaired t test was used for statistical comparison. The differences between the IM and NF-ID (labeled as ID) groups are not statistically significant. (d) Female C57BL/6 mice (n = 3) were immunized with 2, 10 or 50 μg of the pCMV-Gag expression vector at the time points as indicated by the arrows. The PBL collected every 10 days from all the mice in a group were pooled and analyzed for the cytokine expression using the ICS technique. The frequencies of the IFN-γ/TNF-α double positive CD8 T cells identified at each time points are plotted. The data are representative of two independent experiments. The two-way ANOVA was used for the statistical comparison and the differences between groups are not statistically significant.
Figure 2
Figure 2. Suboptimal humoral immune response to DNA-encoded antigens following the NF-ID immunization.
(a) Groups of mice, C57BL/6 (n = 12, left panel) or BALB/c (n = 4–6, right panel), were primed and four weeks later boosted. The blood samples were collected after 11 days following the booster immunization (See Fig. 1a for the immunization schematic). The titers of the Gag-specific antibodies were determined using an indirect ELISA. The absorbance values (mean ± SEM) of the serially diluted serum samples are plotted. The dotted lines represent the cut-off value of the assay (mean + 2SD of the null vector group). The data are representative of several independent experiments. The statistical difference between the NF-ID and IM routes was compared at the 100-fold dilution using the unpaired t test. (b) The blood of the C57BL/6 mice immunized as in Fig. 1c collected at different time points, the plasma samples pooled within a group, assessed by ELISA at a 100-fold dilution, and the absorbance values are plotted. The dotted line represents the cut-off value defined as two times the mean absorbance value of the control group immunized with the null vector. The two-way ANOVA was used for the statistical comparison. The differences between the IM and NF-ID immunization of 50 and 10 μg DNA are significant (p < 0.05). (c) The antibody response in the C57BL/6 mice primed by the NF-ID route and boosted by the IM route. The absorbance values of the sera diluted serially (100 to 2500-fold) are plotted (mean ± SEM, n = 4). The ID in the labels refers to NF-ID. (d) The sera of C57BL/6 mice (n = 4) immunized with 50 μg pcDNA3.1-Tat or pCMV-FLuc, as in Fig. 1a, were pooled, diluted 100-fold and evaluated for antigen-specific antibody response by ELISA. The absorbance values (mean ± SD) were plotted and the data are representative of two independent experiments.
Figure 3
Figure 3. Suboptimal IgG, but not the IgM, antibody response following the NF-ID immunization.
Groups of mice, C57BL/6 or BALB/c, were immunized with the pCMV-Gag DNA vector through the NF-ID, or needle-syringe IM or ID route. Each symbol represents an individual animal. The sera obtained 11 days following the booster immunization were diluted 100 and 500-fold for the measurement of IgG in C57BL/6 and BALB/c mice respectively. The IgM from both the strains of mice was measured in serum diluted 100-fold. The assay employed secondary antibodies conjugated to HRP specific to IgM or IgG isotypes. The mean absorbance value of the group and the SEM are shown. The dotted line represents the cut-off value defined as two times the mean absorbance value of the control group of four animals immunized with the null vector. The data of the NF-ID and IM groups were obtained from three independent experiments containing 4–6 mice per group. The data of the needle-syringe ID group were obtained from two independent experiments containing 4 or 6 animals per group. The one-way ANOVA was used for statistical comparison (****p < 0.0001 and **p < 0.001).
Figure 4
Figure 4. Short-lived antigen expression and rapid DNA elimination following NF-ID immunization.
BALB/c mice were injected with 50 μg of the GLuc or FLuc expression vectors or the null vector through the IM or NF-ID route. (a) The GLuc-administered mice were bled at different time points as shown on the X-axis. The serum samples were diluted 10-fold, the luciferase enzyme activity was measured and the data are presented as mean absorbance ± SEM, n = 6. The data are representative of three independent experiments. (b) In the FLuc group, the sites of injection were collected at different points as shown, and the tissues were pulverized and lysed to obtain the whole tissue homogenate. A total protein of 50 μg of the tissue extract was used for the luciferase assay. The luciferase activity was converted into the enzyme activity per mg of the protein and plotted as the mean ± SEM, n = 4. The data are representative of two independent experiments. The two-way ANOVA was used for the statistical evaluation. (c) The quantitative real-time PCR analysis of the total DNA extracted from the muscle or skin tissue following the immunization of the pCMV-Gag DNA vector. A 106 bp region of the CMV promoter was amplified and normalized using the GAPDH control amplified in parallel. The data are presented as the mean ± SEM plasmid copy number per million GAPDH copies. The data are representative of two independent experiments. The two-way ANOVA was used for the statistical comparison (*p < 0.05, **p < 0.001 and ****p < 0.0001). (d) BALB/c mice administered with 20 μg of Alexa Fluor 647-labelled dextran using NF-ID were sacrificed 8 h post injection. The 10 μm thick cryosections of the skin tissue were stained for DAPI and the representative images captured at three different areas were presented.
Figure 5
Figure 5. The repeated booster NF-ID immunization augments the IgG antibody response.
A schematic representation of the prime-boost regimen used for the immunization of groups of male BALB/c mice (four animals per group) depicted at the top. The immunization schedules consisted of a single booster immunization or three booster doses administered within the same time frame. The animals were immunized with 50 μg of the pCMV-Gag expression vector at each immunization. The bar chart represents the anti-Gag IgG response measured from the serum of the immunized mice at the time points indicated in the X-axis. The means of the raw absorbance values obtained from the serum diluted 100 fold were plotted with SEM, n = 4. Two-way ANOVA was used for statistical evaluation (*p < 0.05 and ****p < 0.0001).
Figure 6
Figure 6. The adjuvant coadministration restores the IgG antibody response following the NF-ID immunization.
(a) BALB/c mice were immunized with 50 μg pCMV-Gag DNA in PBS and one of the several adjuvants as shown, 1 μg recombinant mGM-CSF, 30 μg poly (I:C), 25 μg Imiquimod, or 5 μg CpG ODN 2395. The vector immunization via IM served as a positive control for comparison. Two weeks after the booster immunization, the antibody response was measured in sera diluted 100-fold. The absorbance mean ± SEM values are plotted, n = 4. (b) BALB/c (n = 4–8) or (c) C57BL/6 (n = 8) mice were immunized with 50 μg pCMV-Gag DNA vector alone or in combination with the CpG ODN 2395 and/or GM-CSF. The anti-p24 IgG response was determined in ELISA. The means ± SEM of the absorbance values of the groups or the absorbance values obtained from individual serum samples (diluted 100-fold) are plotted in the left and right panels, respectively. The statistical evaluation was carried out using One-way ANOVA (*p < 0.05 and ****p < 0.0001).

Similar articles

References

    1. Pasparakis M., Haase I. & Nestle F. O. Mechanisms regulating skin immunity and inflammation. Nat. Rev. Immunol 14, 289–301 (2014). - PubMed
    1. Di M. P., Perera G. K. & Nestle F. O. The multitasking organ: recent insights into skin immune function. Immunity 35, 857–869 (2011). - PubMed
    1. Hickling J. K. et al. Intradermal delivery of vaccines: potential benefits and current challenges. Bull. World Health Organ 89, 221–226 (2011). - PMC - PubMed
    1. Malissen B., Tamoutounour S. & Henri S. The origins and functions of dendritic cells and macrophages in the skin. Nat. Rev. Immunol 14, 417–428 (2014). - PubMed
    1. Henri S. et al. CD207+ CD103+ dermal dendritic cells cross-present keratinocyte-derived antigens irrespective of the presence of Langerhans cells. J. Exp. Med 207, 189–206 (2010). - PMC - PubMed