. 2016 Sep 23:6:33994.
doi: 10.1038/srep33994.

The Healthy Infant Nasal Transcriptome: A Benchmark Study

Affiliations

The Healthy Infant Nasal Transcriptome: A Benchmark Study

Chin-Yi Chu et al. Sci Rep. .

Abstract

Responses by resident cells are likely to play a key role in determining the severity of respiratory disease. However, sampling of the airways poses a significant challenge, particularly in infants and children. Here, we report a reliable method for obtaining nasal epithelial cell RNA from infants for genome-wide transcriptomic analysis, and describe baseline expression characteristics in an asymptomatic cohort. Nasal epithelial cells were collected by brushing of the inferior turbinates, and gene expression was interrogated by RNA-seq analysis. Reliable recovery of RNA occurred in the absence of adverse events. We observed high expression of epithelial cell markers and similarity to the transcriptome for intrapulmonary airway epithelial cells. We identified genes displaying low and high expression variability, both inherently, and in response to environmental exposures. The greatest gene expression differences in this asymptomatic cohort were associated with the presence of known pathogenic viruses and/or bacteria. Robust bacteria-associated gene expression patterns were significantly associated with the presence of Moraxella. In summary, we have developed a reliable method for interrogating the infant airway transcriptome by sampling the nasal epithelium. Our data demonstrates both the fidelity and feasibility of our methodology, and describes normal gene expression and variation within a healthy infant cohort.


Figures

Figure 1
Figure 1. Nasal sample collection and transcriptome generation overview diagram.
Summary of the major steps involved in healthy infant nasal airway sample collection and transcriptome generation. The procedure is described in Methods, and a detailed protocol is provided in the data supplement.
Figure 2
Figure 2. RNA and sequencing quality assessment.
Details are provided for RNA recovered (A), total number of sequencing reads generated (B), and the proportion of the genome for which transcripts were detected (C), for each of the samples.
Figure 3
Figure 3. Candidate epithelial and inflammatory cell gene expression.
Individual genes are indicated as rows, and individual subjects as columns. Relatively high expression is indicated by red and relatively low expression is indicated by green. (A) Expression estimates of candidate epithelial cell and leukocyte genes are presented. The data indicate consistently high levels of expression for epithelial cell markers including prototypical nasal epithelial cell genes (BPIFs), general epithelial cell genes (CDH1) and some mucosal epithelial cell markers (MUC1/2/4/16/20). Conversely, the data indicate relatively low levels of expression for most leukocyte markers including lymphocyte genes (CD3/8/19/56), neutrophil genes (MPO) and generic hematopoietic genes (CD34). (B) We further assessed the expression of a subset of genes used to define leukocyte subtypes. The data indicate that all leukocyte markers are expressed at a much lower level than epithelial cell markers. Among the leukocyte markers, genes associated with granulocytes, mast cells and macrophages appear to be most highly expressed.
Figure 4
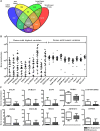
Figure 4. Analysis of human infant airway transcriptome (HINT).
(A) We compared the 7081 non-ubiquitously expressed genes detected in the healthy infant nasal transcriptome, to those genes identified as representing airway transcritpomes in teenage nasal brushing, large/upper airway brushings and small/lower airway brushings. A large proportion of the genes (82%) were detected in both nasal, large and small airways. (B,C) We identified genes that displayed extremes of variation across subjects. (B) We calculated the coefficient of variation for expression of each gene across all subjects. Displayed are the relative expression estimates for the 10 genes with either the highest or lowest variation. (C) We tested for genes whose expression variance was significantly associated with all demographic variables. Displayed are the group-wise expression levels and variation in expression for 10 genes that displayed significant differences in expression variance in subjects exposed to environmental tobacco smoke as compared to those with no exposure.
Figure 5
Figure 5. Gene expression associated with microbial burden.
The abundance of all taxonomical units for selected pathogens was defined by 16S sequencing and assessed for correlation with host gene expression. Taxonomical units for each of the pathogens are presented as individual rows, while each subject is represented by a column. A relatively high abundance for each taxon is indicated by red. A large number of genes were significantly associated with the burden of any Moraxellaceae family taxon, and specifically for genus Moraxella, whereas no appreciable gene expression was associated with the abundance of other pathogens.
Figure 6
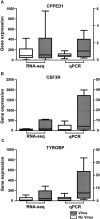
Figure 6. qPCR validation of virus-related expression variance.
We performed qPCR to confirm differences in gene expression variance associated with the presence or absence of detectable virus in the nares of healthy infants. Shown are median, upper quartile and lower quartile expression for CPPED1 (panel A), CSF3R (panel B) and TYROBP (panel C). The left side of each panel displays absolute expression estimates based upon RNA-seq. The right side of each panel displays relative expression determined by qPCR. Data from subjects with detectable virus (n = 9) are in grey, while data from subjects without detectable virus (n = 41) are in white.

References

    1. Agusti A., Sobradillo P. & Celli B. Addressing the complexity of chronic obstructive pulmonary disease: from phenotypes and biomarkers to scale-free networks, systems biology, and P4 medicine. American journal of respiratory and critical care medicine 183, 1129–1137 (2011). - PubMed
    1. Gauthier M., Ray A. & Wenzel S. E. Evolving Concepts of Asthma. American journal of respiratory and critical care medicine 192, 660–668 (2015). - PMC - PubMed
    1. Woodruff P. G., Agusti A., Roche N., Singh D. & Martinez F. J. Current concepts in targeting chronic obstructive pulmonary disease pharmacotherapy: making progress towards personalised management. Lancet 385, 1789–1798 (2015). - PMC - PubMed
    1. Poole A. et al. Dissecting childhood asthma with nasal transcriptomics distinguishes subphenotypes of disease. The Journal of allergy and clinical immunology 133 (2014). - PMC - PubMed
    1. Zhang X. et al. Similarities and differences between smoking-related gene expression in nasal and bronchial epithelium. Physiological genomics 41, 1–8 (2010). - PMC - PubMed