Observational Study
. 2017 Apr;139(4):1302-1310.e4.
doi: 10.1016/j.jaci.2016.07.040. Epub 2016 Sep 19.

A prospective study on the natural history of patients with profound combined immunodeficiency: An interim analysis

Affiliations
Observational Study

A prospective study on the natural history of patients with profound combined immunodeficiency: An interim analysis

Carsten Speckmann et al. J Allergy Clin Immunol. 2017 Apr.

Abstract

Background: Absent T-cell immunity resulting in life-threatening infections provides a clear rationale for hematopoetic stem cell transplantation (HSCT) in patients with severe combined immunodeficiency (SCID). Combined immunodeficiencies (CIDs) and "atypical" SCID show reduced, not absent T-cell immunity. If associated with infections or autoimmunity, they represent profound combined immunodeficiency (P-CID), for which outcome data are insufficient for unambiguous early transplant decisions.

Objectives: We sought to compare natural histories of severity-matched patients with/without subsequent transplantation and to determine whether immunologic and/or clinical parameters may be predictive for outcome.

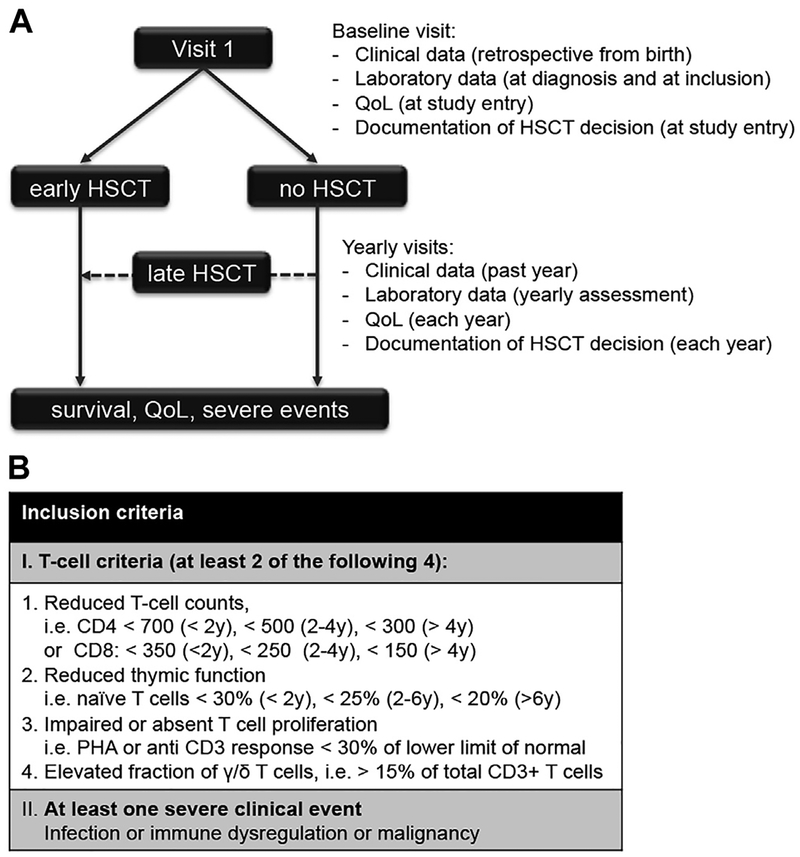
Methods: In this prospective and retrospective observational study, we recruited nontransplanted patients with P-CID aged 1 to 16 years to compare natural histories of severity-matched patients with/without subsequent transplantation and to determine whether immunologic and/or clinical parameters may be predictive for outcome.

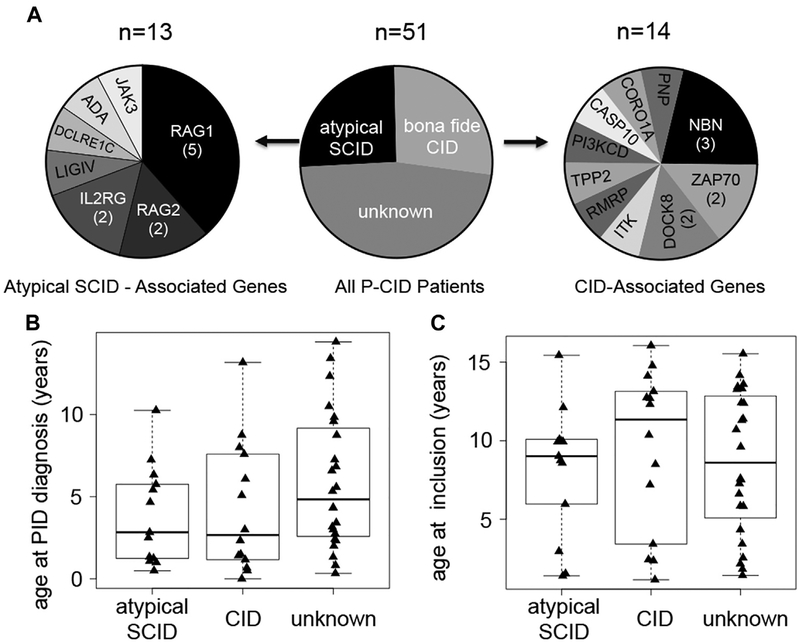
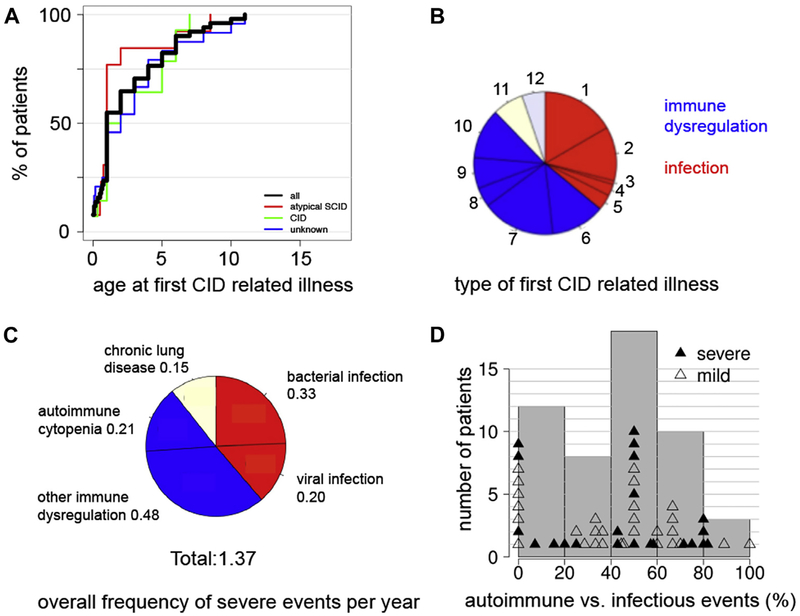
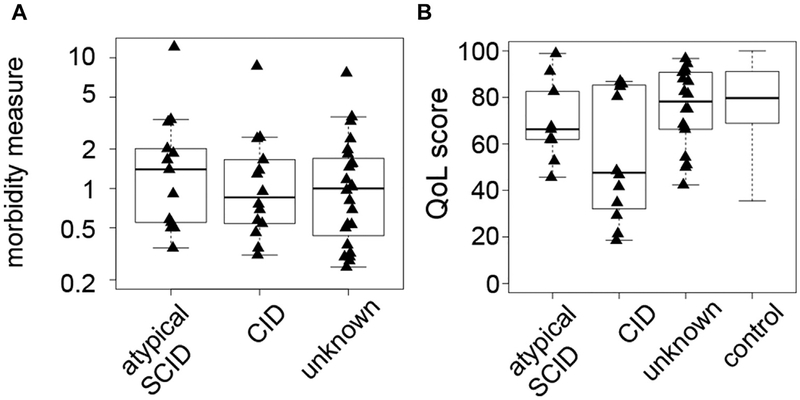
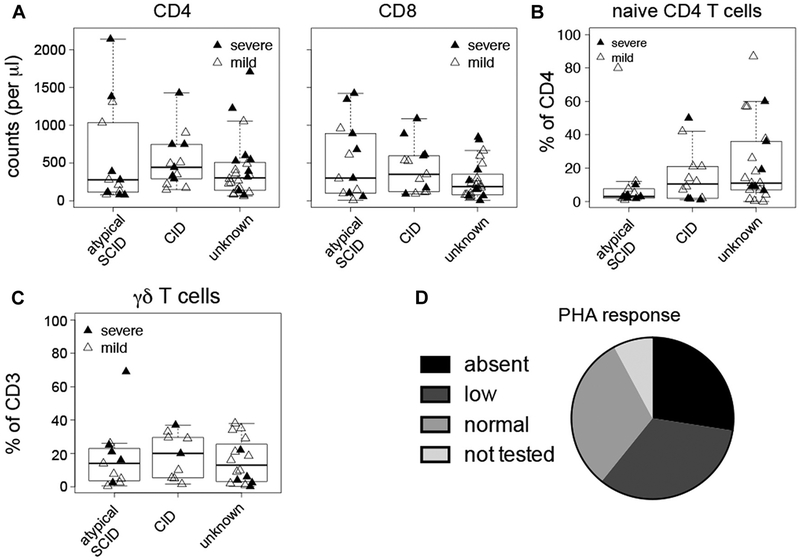
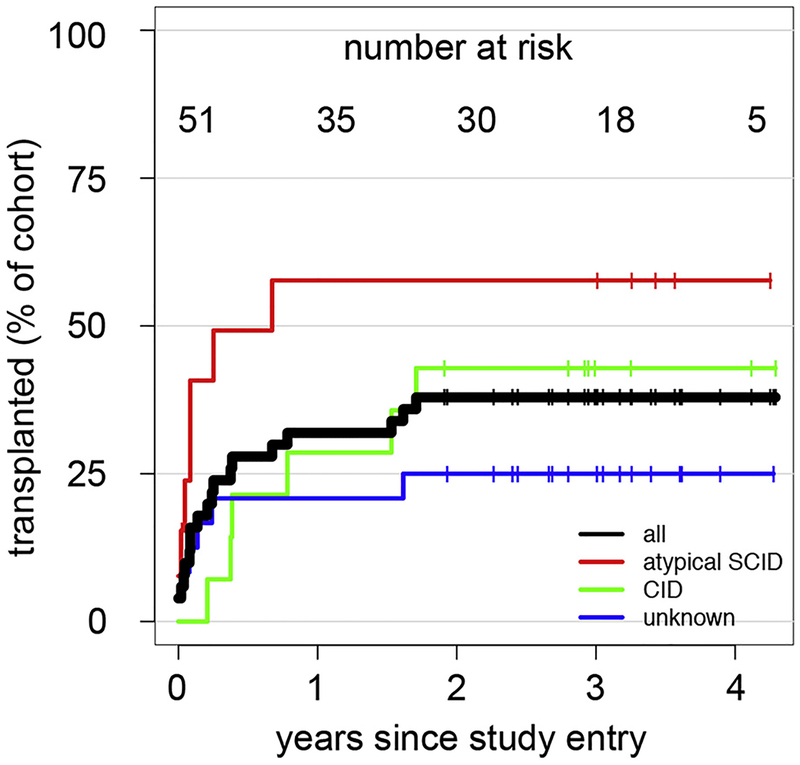
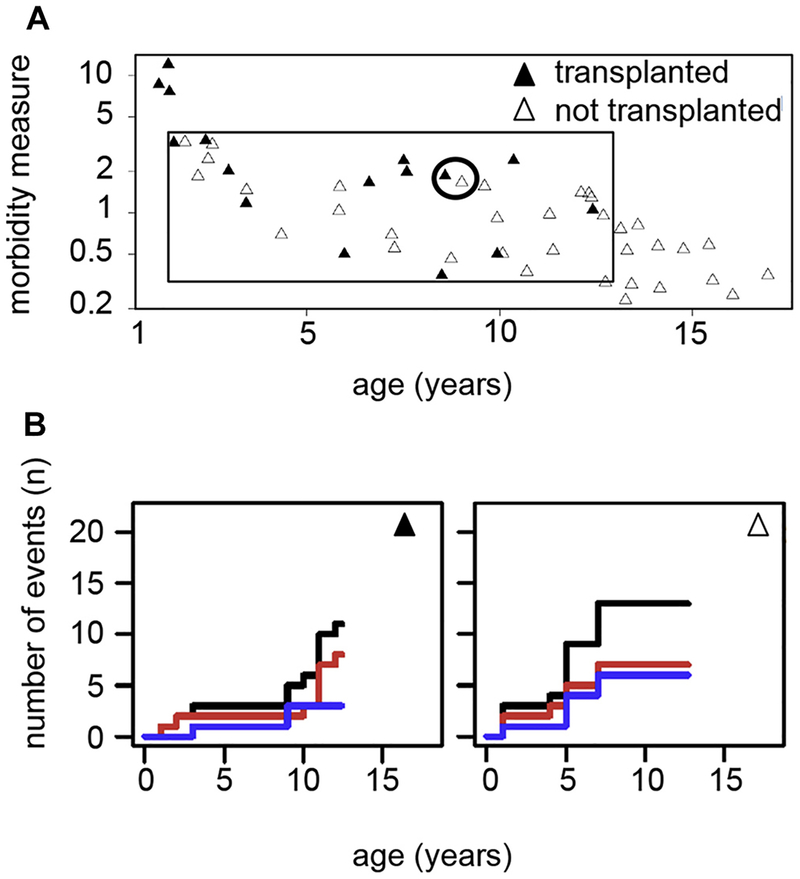
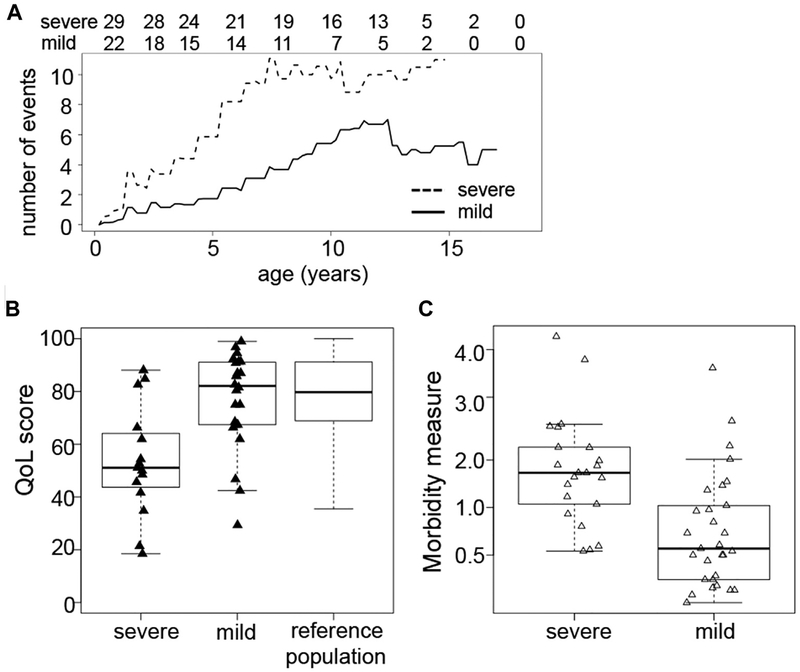
Results: A total of 51 patients were recruited (median age, 9.6 years). Thirteen of 51 had a genetic diagnosis of "atypical" SCID and 14 of 51 of CID. About half of the patients had less than 10% naive T cells, reduced/absent T-cell proliferation, and at least 1 significant clinical event/year, demonstrating their profound immunodeficiency. Nineteen patients (37%) underwent transplantation within 1 year of enrolment, and 5 of 51 patients died. Analysis of the HSCT decisions revealed the anticipated heterogeneity, favoring an ongoing prospective matched-pair analysis of patients with similar disease severity with or without transplantation. Importantly, so far neither the genetic diagnosis nor basic measurements of T-cell immunity were good predictors of disease evolution.

Conclusions: The P-CID study for the first time characterizes a group of patients with nontypical SCID T-cell deficiencies from a therapeutic perspective. Because genetic and basic T-cell parameters provide limited guidance, prospective data from this study will be a helpful resource for guiding the difficult HSCT decisions in patients with P-CID.

Keywords: T-cell deficiency; combined immunodeficiency; hematopoietic stem cell transplantation; natural history.


Conflict of interest statement

Disclosure of potential conflict of interest: C. Speckmann receives grant support from the German Ministry for Education and Research (BMBF); payments for lectures from Octapharma and CSL Behring; and travel support from Orphan Europe and CSL Behring. A. Aiuti receives grant support from the European Research Council, Fondazione Telethon Rome, Italian Ministry of Health, and GSK. M. H. Albert receives grant support from GSK; receives payment for lectures from Biotest, MSD, and Jazz; holds stock in Amen and BMS; and receives travel support from Octapharma. T. Avcin serves as a consultant for Octapharma and receives payment for lectures from Octapharma. C. Cancrini receives grant support from Ministero della Salute and European Community and serves as a consultant for UCB CellTech UK. A. Finocchi receives grant support from Telethon. H. Bobby Gaspar serves as a consultant for Orchard Therapeutics and holds stock in Orchard Therapeutis. K. Gilmour receives travel support from UKPIN. M. Hoenig receives payment for lectures from CSL Behring and Jazz Pharma and travel support from CSL Behring and Jazz Pharma. L. Notarangelo serves on the board of Novimmune and receives grant support from the National Institutes of Health and royalties from Up-to-Date. M. G. Seidel serves as a consultant for Baxalta and Novartis; received payments for lectures from Jazz Pharmaceuticals, Novartis, and CSL Behring; and received travel support from Jazz Pharmaceuticals, Octapharma, and Amgen. P. Soler-Palacin receives travel support from the P-CID study group; expert testimony from CSL Behring, Octapharma, Grifols, and Baxter; grant support from CSL Behring; and payments for lectures from Grifols. K. Warnatz serves on the board for BioTest, CSL Behring, and LFB Biomedicaments; receives grant support from BMS, CSL Behring, and BioTest; and receives payments for lecture from LFB Biomedicaments, Baxter, GSK, CSL Behring, Pfizer, BioTest, Novartis Pharma, Roche, Octapharma, and UCB Pharma. A. Worth receives research support from the National Institute of Health Research and Wellcome Trust. A. Uhlmann receives travel support from BMBF. S. Ehl receives research support from BMBF, the Canadian Immunodeficiency Society, and European Union’s Horizon 2020 Research and Innovation Programme; serves as a consultant for UCD and Novartis but not in the context of this study; and received payments from lectures for CSL Behring. The rest of the authors declare that they have no relevant conflicts of interest.

Figures

FIG 1.
FIG 1.
Overview of the study design and inclusion criteria. A, Each patient is seen in at least 6 study visits (1 baseline visit and 5 follow-up visits). At each visit, clinical data, laboratory data, QOL, and the local center’s decision on HSCT are documented. This decision is not influenced by the study protocol. Patients who undergo HSCT within 12 months after inclusion are followed in the “early HSCT” arm, the other patients in the “No HSCT” arm. Some patients receive HSCT during follow-up (“late HSCT”). After an observation period of at least 5 years, survival, QOL, and the frequency of severe clinical events are assessed in the whole cohort. B, Inclusion criteria. Nontransplanted HIV-negative patients, 1 to 16 years of age, with impaired T-cell immunity and at least 1 severe clinical event are included into the study.
FIG 2.
FIG 2.
Molecular diagnoses and age at study inclusion. A, Among 51 patients, 13 had mutations in genes that can also cause a SCID phenotype (“atypical” SCID; left pie chart). Fourteen patients had mutations in other genes associated with CID (right pie chart). Twenty-four patients currently remain without genetic diagnosis. ADA, Adenosine deaminase; CASP10, caspase-10; CORO1A, coronin-1A; DCLRE1C, DNA cross-link repair 1C; DOCK8, dedicator of cytokinesis 8; JAK3, Janus kinase 3; LIGIV, ligase IV; NBN, nibrin; PI3KCD, phosphoinositide 3-kinase; PNP, purine nucleoside phosphorylase; RAG1/2, recombination-activating genes 1 and 2; RMRP, RNA component of mitochondrial RNA processing endoribonuclease; TPP2, tripeptidyl-peptidase II. B, Age at diagnosis, that is, the time point at which the treating physician diagnosed an underlying immunodeficiency. C, Age at inclusion into the P-CID study. Data for B and C were evaluated separately for patients with atypical SCID, CID, or unknown molecular cause.
FIG 3.
FIG 3.
Key clinical characteristics of the P-CID study cohort. A, Cumulative percentage of patients having suffered from their first immunodeficiency-related illness at a given age for all patients (black line) and the 3 subgroups (color code indicated in figure). B, Type of immunodeficiency-related illnesses within the first year of clinical presentation. 1, invasive bacterial infection; 2, severe acute viral infection; 3, persistent viral infection; 4, opportunistic infection; 5, other infection; 6, autoimmune disease; 7, skin disease; 8, gastrointestinal disease; 9, lymphoproliferation; 10, autoimmune cytopenia; 11, chronic lung disease; 12, other ID-related organ complication. C, Overall frequency of severe clinical events. The pie chart illustrates the relative frequency of all individual clinical events observed in all patients of the cohort. The number indicates the mean number of events per year among all patients in the study. D, Relative distribution of infections versus manifestations of immune dysregulation as defined for the morbidity measure for all individual patients (mild disease course, open triangles; severe disease course, filled triangles). “50%” indicates an equally balanced distribution of infections/immune dysregulation events. Patients between the range of 50% to 100% predominantly had manifestations of immune dysregulation, and patients between the range of 0% to 50% predominantly had infections. Gray bars summarize the individual patients in groups.
FIG 4.
FIG 4.
Morbidity assessment and baseline QOL of the P-CID study cohort. A, Morbidity measure in patients with atypical SCID, CID, and unknown molecular diagnosis. B, QOL at study entry as assessed by PedsQL Generic Core Scales of patients with atypical SCID, CID, and unknown molecular diagnosis vs a reference population of healthy children.
FIG 5.
FIG 5.
Immunologic parameters at study inclusion. In A-C, data are shown separately for patients with atypical SCID, CID, and unknown molecular diagnosis. Filled triangles represent patients with a severe disease course, open triangles patients with a mild disease course. A, Counts of CD4 T cells (left panel) and CD8 T cells (right panel). B, Naive CD4 T cells determined as percentage of CD45RA+CD62L+ or CD45RA+CD31+ of CD4 T cells. C, Percentage of γ/δ TCR+ among CD3 T cells. D, T-cell proliferation response (absent, <10%; low, 10% to 30%; normal, >30% of local control) after stimulation with PHA.
FIG 6.
FIG 6.
Patients undergoing HSCT since study inclusion. Kaplan-Meyer curve indicating the cumulative percentage of patients who underwent transplantation at a given time after study inclusion. Results are shown for all patients (black line) and the 3 subgroups (color code indicated in figure). Vertical lines indicate the time point of censoring for individual patients. The absolute number of patients at risk at a given time is indicated at the top of the figure.
FIG 7.
FIG 7.
Graphical illustration documenting the feasibility of the planned matched-pair analysis. A, Assessment of morbidity measures plotted against the age at study inclusion for all patients. Patients who underwent transplantation within the first year after inclusion are represented by filled triangles, nontransplanted patients by open triangles. Inside the black-rimmed box are patients who will be included in the future matched-pair analysis. Outside the box are patients who are either very sick very early (“SCID-like,” left outside the box) or patients who are quite healthy as teenagers (“CVID-like,” right outside the box) and therefore not informative for the matched-pair analysis. The circle indicates the patient pair further visualized in B. B, Example of a patient pair with a similar morbidity measure who will quality for a matched-pair analysis. The staircase diagrams summarize the clinical course of an individual patient over time. Individual clinical events are indicated by an upward step on the y-axis. The cumulative course of all clinical events per patient is indicated by a black line. A separate analysis of infections and manifestations of immune dysregulation is given in red and blue, respectively.
FIG E1.
FIG E1.
Correlation of different parameters assessing disease severity. A, Mean cumulative number of events at a given age for patients judged to have a severe (dashed line) or a mild disease course (solid line) at study entry. The absolute number of patients at risk at a given time is indicated in the line above the figure. B, QOL scores at study entry for patients with a severe or a mild disease score. C, Morbidity measure in patients with severe and mild disease course as judged by the treating physician.
FIG E2.
FIG E2.
Summary of clinical course of RAG-deficient patients. Each staircase diagram summarizes the clinical course of an individual patient with a mutation in RAG1 or 2 over time. Individual clinical events are indicated by an upward step on the y-axis. The cumulative course of all clinical events per patient is indicated by a black line. A separate cumulative analysis of infections and manifestations of immune dysregulation is given in red and blue, respectively. Black circles in the upper left corner indicate patients who underwent HSCT less than 1 year after study inclusion. Red circles in the upper right corner indicate patients with severe course as judged by their primary physician.

Similar articles

Cited by

References

    1. Buckley R Primary immunodeficiency diseases due to defects in lymphocytes. N Engl J Med 2000;343:1313–24. - PubMed
    1. Notarangelo LD. Primary immunodeficiencies. J Allergy Clin Immunol 2010;125: S182–94. - PubMed
    1. Roifman CM, Somech R, Kavadas F, Pires L, Nahum A, Dalal I, et al. Defining combined immunodeficiency. J Allergy Clin Immunol 2012;130:177–83. - PubMed
    1. Al-Herz W, Bousfiha A, Casanova J-L, Chatila T, Conley ME, Cunningham-Rundles C, et al. Primary immunodeficiency diseases: an update on the classification from the International Union of Immunological Societies Expert Committee for Primary Immunodeficiency. Front Immunol 2014;5:162. - PMC - PubMed
    1. Ameratunga R, Brewerton M, Slade C, Jordan A, Gillis D, Steele R, et al. Comparison of diagnostic criteria for common variable immunodeficiency disorder. Front Immunol 2014;5:415. - PMC - PubMed

Publication types