

Development and validation of an electronic medical record-based alert score for detection of inpatient deterioration outside the ICU
- PMID: 27658885
- PMCID: PMC5510648
- DOI: 10.1016/j.jbi.2016.09.013
Development and validation of an electronic medical record-based alert score for detection of inpatient deterioration outside the ICU
Abstract
Background: Patients in general medical-surgical wards who experience unplanned transfer to the intensive care unit (ICU) show evidence of physiologic derangement 6-24h prior to their deterioration. With increasing availability of electronic medical records (EMRs), automated early warning scores (EWSs) are becoming feasible.
Objective: To describe the development and performance of an automated EWS based on EMR data.
Materials and methods: We used a discrete-time logistic regression model to obtain an hourly risk score to predict unplanned transfer to the ICU within the next 12h. The model was based on hospitalization episodes from all adult patients (18years) admitted to 21 Kaiser Permanente Northern California (KPNC) hospitals from 1/1/2010 to 12/31/2013. Eligible patients met these entry criteria: initial hospitalization occurred at a KPNC hospital; the hospitalization was not for childbirth; and the EMR had been operational at the hospital for at least 3months. We evaluated the performance of this risk score, called Advanced Alert Monitor (AAM) and compared it against two other EWSs (eCART and NEWS) in terms of their sensitivity, specificity, negative predictive value, positive predictive value, and area under the receiver operator characteristic curve (c statistic).
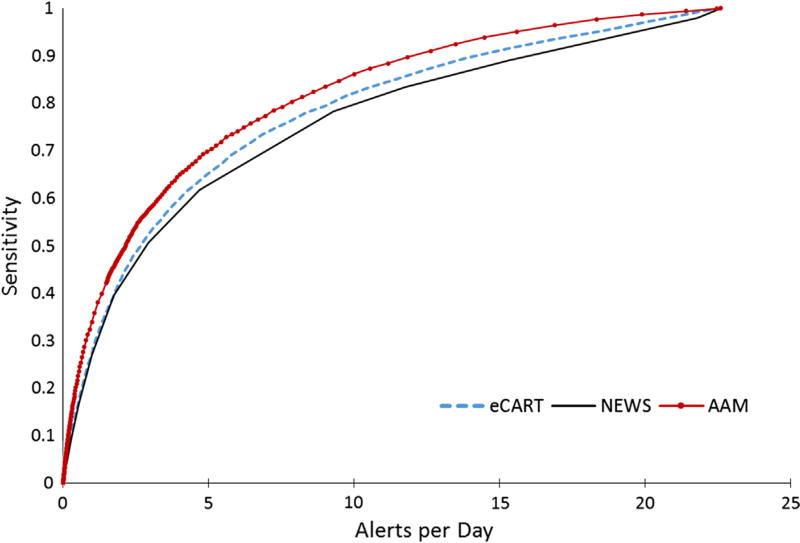
Results: A total of 649,418 hospitalization episodes involving 374,838 patients met inclusion criteria, with 19,153 of the episodes experiencing at least one outcome. The analysis data set had 48,723,248 hourly observations. Predictors included physiologic data (laboratory tests and vital signs); neurological status; severity of illness and longitudinal comorbidity indices; care directives; and health services indicators (e.g. elapsed length of stay). AAM showed better performance compared to NEWS and eCART in all the metrics and prediction intervals. The AAM AUC was 0.82 compared to 0.79 and 0.76 for eCART and NEWS, respectively. Using a threshold that generated 1 alert per day in a unit with a patient census of 35, the sensitivity of AAM was 49% (95% CI: 47.6-50.3%) compared to the sensitivities of eCART and NEWS scores of 44% (42.3-45.1) and 40% (38.2-40.9), respectively. For all three scores, about half of alerts occurred within 12h of the event, and almost two thirds within 24h of the event.
Conclusion: The AAM score is an example of a score that takes advantage of multiple data streams now available in modern EMRs. It highlights the ability to harness complex algorithms to maximize signal extraction. The main challenge in the future is to develop detection approaches for patients in whom data are sparser because their baseline risk is lower.
Keywords: Critical care; Deterioration; Early warning score; Electronic health records; Patient safety; Physiologic monitoring; Risk score.
Copyright © 2016 Elsevier Inc. All rights reserved.
Conflict of interest statement
The authors declared that there is no conflict of interest.
Figures


Similar articles
-
Early detection of impending physiologic deterioration among patients who are not in intensive care: development of predictive models using data from an automated electronic medical record.J Hosp Med. 2012 May-Jun;7(5):388-95. doi: 10.1002/jhm.1929. Epub 2012 Mar 22. J Hosp Med. 2012. PMID: 22447632
-
The Kaiser Permanente Northern California Advance Alert Monitor Program: An Automated Early Warning System for Adults at Risk for In-Hospital Clinical Deterioration.Jt Comm J Qual Patient Saf. 2022 Aug;48(8):370-375. doi: 10.1016/j.jcjq.2022.05.005. Jt Comm J Qual Patient Saf. 2022. PMID: 35902140
-
Towards development of alert thresholds for clinical deterioration using continuous predictive analytics monitoring.J Clin Monit Comput. 2020 Aug;34(4):797-804. doi: 10.1007/s10877-019-00361-5. Epub 2019 Jul 20. J Clin Monit Comput. 2020. PMID: 31327101
-
Early warning score challenges and opportunities in the care of deteriorating patients .Dan Med J. 2018 Feb;65(2):B5439. Dan Med J. 2018. PMID: 29393044 Review.
-
Development and validation of early warning score system: A systematic literature review.J Biomed Inform. 2020 May;105:103410. doi: 10.1016/j.jbi.2020.103410. Epub 2020 Apr 8. J Biomed Inform. 2020. PMID: 32278089 Free PMC article.
Cited by
-
Effects of Neighborhood-level Data on Performance and Algorithmic Equity of a Model That Predicts 30-day Heart Failure Readmissions at an Urban Academic Medical Center.J Card Fail. 2021 Sep;27(9):965-973. doi: 10.1016/j.cardfail.2021.04.021. Epub 2021 May 26. J Card Fail. 2021. PMID: 34048918 Free PMC article.
-
RAPID-ED: A predictive model for risk assessment of patient's early in-hospital deterioration from emergency department.Resusc Plus. 2024 Feb 6;17:100570. doi: 10.1016/j.resplu.2024.100570. eCollection 2024 Mar. Resusc Plus. 2024. PMID: 38357677 Free PMC article.
-
The number needed to benefit: estimating the value of predictive analytics in healthcare.J Am Med Inform Assoc. 2019 Dec 1;26(12):1655-1659. doi: 10.1093/jamia/ocz088. J Am Med Inform Assoc. 2019. PMID: 31192367 Free PMC article.
-
An Update to the Kaiser Permanente Inpatient Risk Adjustment Methodology Accurately Predicts In-Hospital Mortality: a Retrospective Cohort Study.J Gen Intern Med. 2023 Nov;38(15):3303-3312. doi: 10.1007/s11606-023-08245-w. Epub 2023 Jun 9. J Gen Intern Med. 2023. PMID: 37296357 Free PMC article.
-
Identifying Distinct Subgroups of ICU Patients: A Machine Learning Approach.Crit Care Med. 2017 Oct;45(10):1607-1615. doi: 10.1097/CCM.0000000000002548. Crit Care Med. 2017. PMID: 28640021 Free PMC article.
References
-
- Schein RM, Hazday N, Pena M, Ruben BH, Sprung CL. Clinical antecedents to in-hospital cardiopulmonary arrest. Chest. 1990;98:1388–1392. - PubMed
-
- Hournihan F, Bishop G, Hillman KM, Dauffurn K, Lee A. The medical emergency team: a new strategy to identify and intervene in high-risk surgical patients. Clin. Intens. Care. 1995;6:269–272.
-
- Goldhill DR, Worthington LM, Mulcahy AJ, Tarling MM. Quality of care before admission to intensive care. Deaths on the wards might be prevented. BMJ. 1999;318:195. - PubMed
-
- Goldhill DR, Worthington L, Mulcahy A, Tarling M, Sumner A. The patient-at-risk team: identifying and managing seriously ill ward patients. Anaesthesia. 1999;54:853–860. - PubMed
-
- Subbe CP, Kruger M, Rutherford P, Gemmel L. Validation of a modified early warning score in medical admissions. Q. J. Med. 2001;94:521–526. - PubMed
Publication types
MeSH terms
Grants and funding
LinkOut - more resources
Full Text Sources
Other Literature Sources
Miscellaneous
