

52 Genetic Loci Influencing Myocardial Mass
- PMID: 27659466
- PMCID: PMC5478167
- DOI: 10.1016/j.jacc.2016.07.729
52 Genetic Loci Influencing Myocardial Mass
Abstract
Background: Myocardial mass is a key determinant of cardiac muscle function and hypertrophy. Myocardial depolarization leading to cardiac muscle contraction is reflected by the amplitude and duration of the QRS complex on the electrocardiogram (ECG). Abnormal QRS amplitude or duration reflect changes in myocardial mass and conduction, and are associated with increased risk of heart failure and death.
Objectives: This meta-analysis sought to gain insights into the genetic determinants of myocardial mass.
Methods: We carried out a genome-wide association meta-analysis of 4 QRS traits in up to 73,518 individuals of European ancestry, followed by extensive biological and functional assessment.
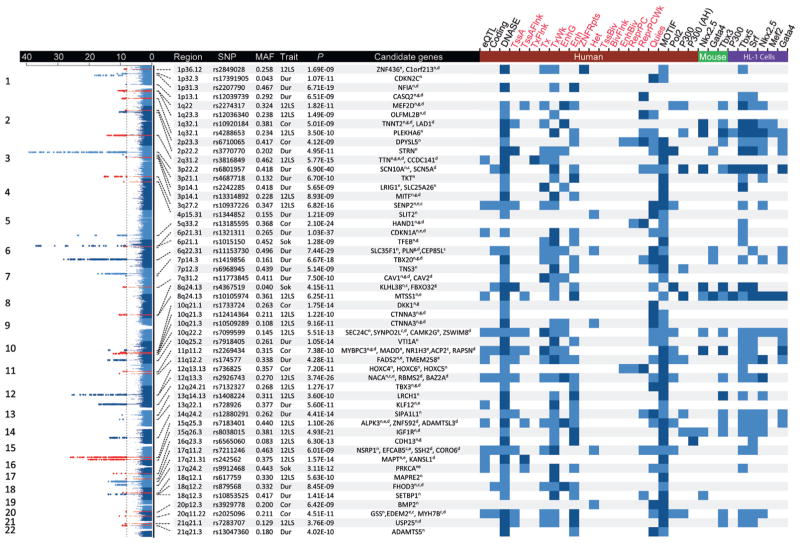
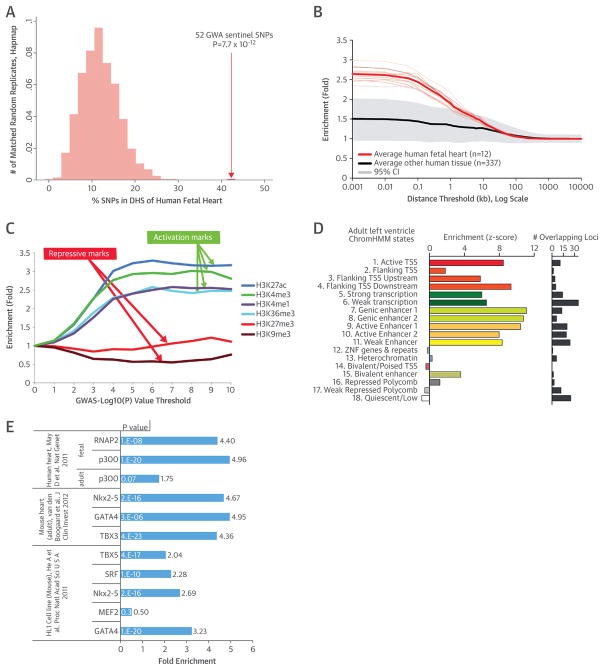
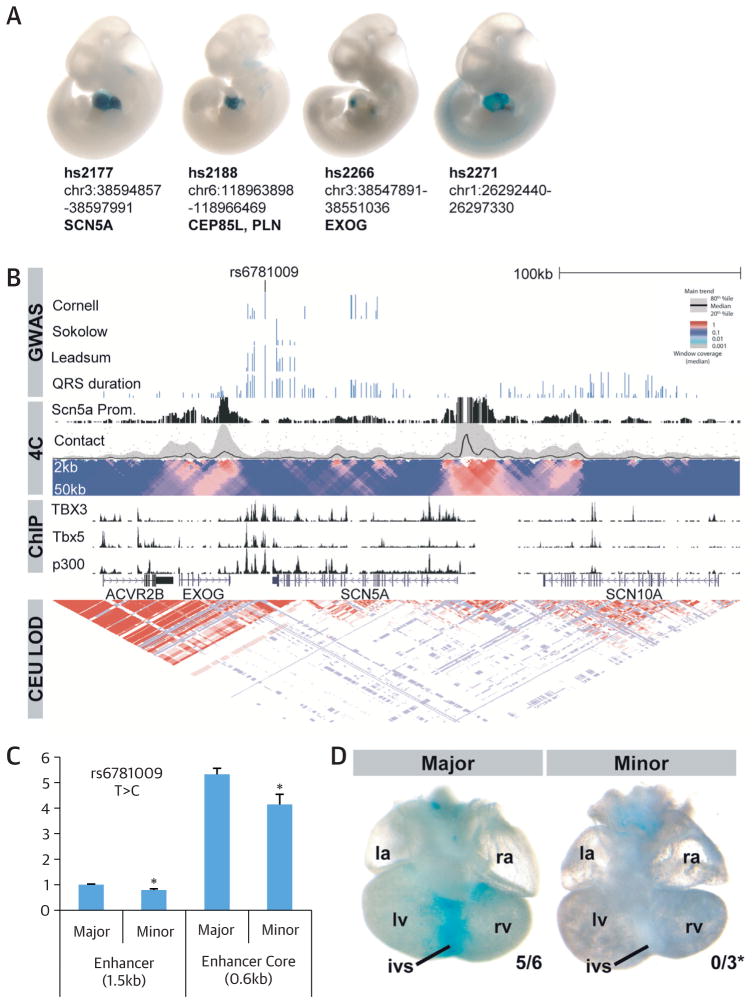
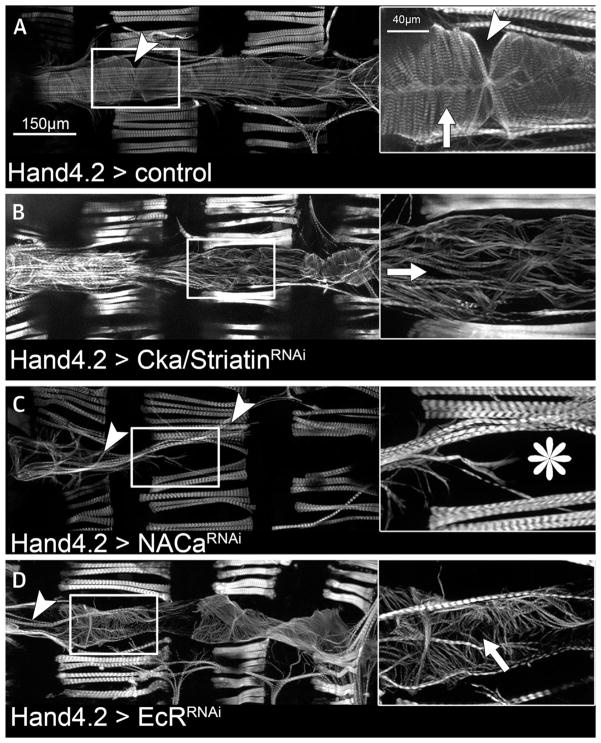
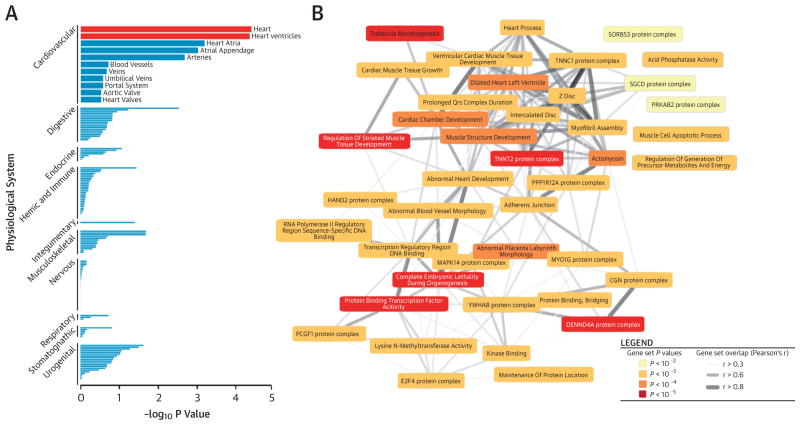
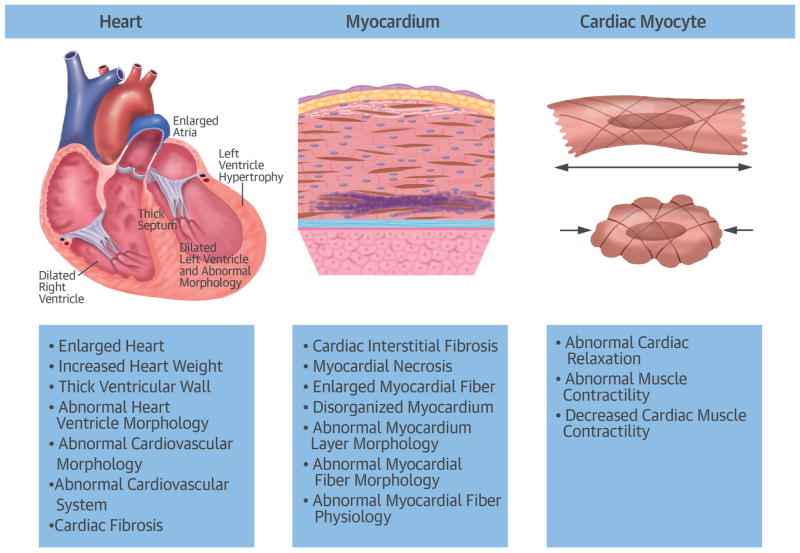
Results: We identified 52 genomic loci, of which 32 are novel, that are reliably associated with 1 or more QRS phenotypes at p < 1 × 10(-8). These loci are enriched in regions of open chromatin, histone modifications, and transcription factor binding, suggesting that they represent regions of the genome that are actively transcribed in the human heart. Pathway analyses provided evidence that these loci play a role in cardiac hypertrophy. We further highlighted 67 candidate genes at the identified loci that are preferentially expressed in cardiac tissue and associated with cardiac abnormalities in Drosophila melanogaster and Mus musculus. We validated the regulatory function of a novel variant in the SCN5A/SCN10A locus in vitro and in vivo.
Conclusions: Taken together, our findings provide new insights into genes and biological pathways controlling myocardial mass and may help identify novel therapeutic targets.
Keywords: QRS; electrocardiogram; genetic association study; heart failure; left ventricular hypertrophy.
Copyright © 2016 American College of Cardiology Foundation. Published by Elsevier Inc. All rights reserved.
Figures
Comment in
-
Unraveling Myocardial Mass: Using Classical ECG With Contemporary GWAS.J Am Coll Cardiol. 2016 Sep 27;68(13):1449-1451. doi: 10.1016/j.jacc.2016.07.727. J Am Coll Cardiol. 2016. PMID: 27659467 No abstract available.
-
Poor Sensitivity and Specificity of Electrocardiographic Estimation of Myocardial Mass.J Am Coll Cardiol. 2017 Feb 28;69(8):1098-1099. doi: 10.1016/j.jacc.2016.10.082. J Am Coll Cardiol. 2017. PMID: 28231937 No abstract available.
-
Reply: Poor Sensitivity and Specificity of Electrocardiographic Estimation of Myocardial Mass.J Am Coll Cardiol. 2017 Feb 28;69(8):1099. doi: 10.1016/j.jacc.2016.11.057. J Am Coll Cardiol. 2017. PMID: 28231938 No abstract available.
References
-
- Levy D, Labib SB, Anderson KM, Christiansen JC, Kannel WB, Castelli WP. Determinants of sensitivity and specificity of electrocardiographic criteria for left ventricular hypertrophy. Circulation. 1990;81:815–20. - PubMed
-
- Okin PM, Roman MJ, Devereux RB, Pickering TG, Borer JS, Kligfield P. Time-voltage QRS area of the 12-lead electrocardiogram: detection of left ventricular hypertrophy. Hypertension. 1998;31:937–42. - PubMed
-
- Kannel WB, Gordon T, Offutt D. Left ventricular hypertrophy by electrocardiogram. Prevalence, incidence, and mortality in the Framingham study. Ann Intern Med. 1969;71:89–105. - PubMed
-
- Verdecchia P, Schillaci G, Borgioni C, et al. Prognostic value of a new electrocardiographic method for diagnosis of left ventricular hypertrophy in essential hypertension. J Am Coll Cardiol. 1998;31:383–90. - PubMed
-
- Usoro AO, Bradford N, Shah AJ, Soliman EZ. Risk of mortality in individuals with low QRS voltage and free of cardiovascular disease. Am J Cardiol. 2014;113:1514–7. - PubMed
MeSH terms
Grants and funding
- HHSN268201100010C/HL/NHLBI NIH HHS/United States
- R01 HL087652/HL/NHLBI NIH HHS/United States
- R01 HL105756/HL/NHLBI NIH HHS/United States
- HHSN268201200036C/HL/NHLBI NIH HHS/United States
- R01 LM010098/LM/NLM NIH HHS/United States
- UL1 TR000040/TR/NCATS NIH HHS/United States
- N01 HC095163/HC/NHLBI NIH HHS/United States
- N01 HC095159/HC/NHLBI NIH HHS/United States
- R01 HG003988/HG/NHGRI NIH HHS/United States
- HHSN268201100012C/HL/NHLBI NIH HHS/United States
- R01 HL103612/HL/NHLBI NIH HHS/United States
- N01 HC085080/HL/NHLBI NIH HHS/United States
- N01 AG012100/AG/NIA NIH HHS/United States
- R01 HL120393/HL/NHLBI NIH HHS/United States
- UL1 RR025005/RR/NCRR NIH HHS/United States
- N01 HC095167/HC/NHLBI NIH HHS/United States
- HHSN268201100008C/HL/NHLBI NIH HHS/United States
- U01 HL080295/HL/NHLBI NIH HHS/United States
- UL1 TR001079/TR/NCATS NIH HHS/United States
- N02 HL064278/HL/NHLBI NIH HHS/United States
- N01 HC085082/HL/NHLBI NIH HHS/United States
- R01 HL059367/HL/NHLBI NIH HHS/United States
- U01 HL130114/HL/NHLBI NIH HHS/United States
- HHSN268201100007C/HL/NHLBI NIH HHS/United States
- HHSN268200800007C/HL/NHLBI NIH HHS/United States
- N01 HC085086/HL/NHLBI NIH HHS/United States
- N01 HC085083/HL/NHLBI NIH HHS/United States
- U01 HL120393/HL/NHLBI NIH HHS/United States
- N01 HC025195/HC/NHLBI NIH HHS/United States
- HHSN268201100011C/HL/NHLBI NIH HHS/United States
- R01 HL086694/HL/NHLBI NIH HHS/United States
- N01 HC095164/HC/NHLBI NIH HHS/United States
- N01 HC095166/HC/NHLBI NIH HHS/United States
- UL1 TR000124/TR/NCATS NIH HHS/United States
- N01 HC095160/HC/NHLBI NIH HHS/United States
- U01 HG004402/HG/NHGRI NIH HHS/United States
- T32 GM007753/GM/NIGMS NIH HHS/United States
- P30 DK063491/DK/NIDDK NIH HHS/United States
- HHSN268201100006C/HL/NHLBI NIH HHS/United States
- N01 HC055222/HL/NHLBI NIH HHS/United States
- UM1 HL098166/HL/NHLBI NIH HHS/United States
- N01 HC085079/HL/NHLBI NIH HHS/United States
- F32 GM105202/GM/NIGMS NIH HHS/United States
- N01 HC095169/HC/NHLBI NIH HHS/United States
- N01 AG012109/AG/NIA NIH HHS/United States
- MC_PC_U127561128/MRC_/Medical Research Council/United Kingdom
- N01 HC095165/HC/NHLBI NIH HHS/United States
- HHSN268201500003I/HL/NHLBI NIH HHS/United States
- HHSN268201100009C/HL/NHLBI NIH HHS/United States
- HHSN268201100005C/HL/NHLBI NIH HHS/United States
- N01 HC095168/HC/NHLBI NIH HHS/United States
- U54 HG006997/HG/NHGRI NIH HHS/United States
- R01 AG023629/AG/NIA NIH HHS/United States
- R01 HL087641/HL/NHLBI NIH HHS/United States
- N01 HC095162/HC/NHLBI NIH HHS/United States
- R24 HL123879/HL/NHLBI NIH HHS/United States
- N01 HC085081/HL/NHLBI NIH HHS/United States
- K23 HL080025/HL/NHLBI NIH HHS/United States
- R01 HL111089/HL/NHLBI NIH HHS/United States
- R01 HL116747/HL/NHLBI NIH HHS/United States
- PG/12/38/29615/BHF_/British Heart Foundation/United Kingdom
LinkOut - more resources
Full Text Sources
Other Literature Sources
Molecular Biology Databases
Miscellaneous
