. 2016 Sep 23:6:33653.
doi: 10.1038/srep33653.

Liprin-α1 and ERC1 control cell edge dynamics by promoting focal adhesion turnover

Affiliations

Liprin-α1 and ERC1 control cell edge dynamics by promoting focal adhesion turnover

Veronica Astro et al. Sci Rep. .

Abstract

Liprin-α1 and ERC1 are interacting scaffold proteins regulating the motility of normal and tumor cells. They act as part of plasma membrane-associated platforms at the edge of motile cells to promote protrusion by largely unknown mechanisms. Here we identify an amino-terminal region of the liprin-α1 protein (liprin-N) that is sufficient and necessary for the interaction with other liprin-α1 molecules. Similar to liprin-α1 or ERC1 silencing, expression of the liprin-N negatively affects tumor cell motility and extracellular matrix invasion, acting as a dominant negative by interacting with endogenous liprin-α1 and causing the displacement of the endogenous ERC1 protein from the cell edge. Interfering with the localization of ERC1 at the cell edge inhibits the disassembly of focal adhesions, impairing protrusion. Liprin-α1 and ERC1 proteins colocalize with active integrin β1 clusters distinct from those colocalizing with cytoplasmic focal adhesion proteins, and influence the localization of peripheral Rab7-positive endosomes. We propose that liprin-α1 and ERC1 promote protrusion by displacing cytoplasmic adhesion components to favour active integrin internalization into Rab7-positive endosomes.


Figures

Figure 1
Figure 1. The amino-terminal region of liprin-α1 is necessary and sufficient for the formation of homo-complexes.
(a) Scheme of the constructs used in this study. In (bf) COS7 cells cotransfected with the indicated GFP-tagged and/or FLAG-tagged constructs were lysed for immunoprecipitation with the indicated antibodies; 300 μg of protein lysate were used for each immunoprecipitation; lanes with lysates were loaded with 30 μg of protein. (b) Filters from immunoprecipitations with anti-GFP antibody (IP, left) and from lysates (right). GFP-Liprin-N (N) interacts with full length FLAG-Liprin-α1 (FL), but not with FLAG-Liprin-ΔN (ΔN). Control lanes were loaded with immunoprecipitates from lysates of cells transfected only with FLAG-Liprin constructs. (c) Left: immunoprecipitations (IP) with anti-GFP (GFP) or control IgG (IgG) from lysates of cells cotransfected with FLAG-Liprin-α1 (FLAG-Lip) and GFP-Liprin-N (GFP-Lip-N), or with FLAG-Liprin-α1 only. Right: blots from gels loaded with aliquots of lysates. (d,e) Filters with immunoprecipitations (IP, top) and aliquots of lysates (bottom) from cells cotransfected/transfected with the indicated GFP- and/or FLAG-tagged constructs were incubated with anti-FLAG antibodies, then stripped and re-incubated with anti-GFP antibodies. (f) Lysates from cells transfected with GFP-Liprin-N or from non-transfected cells were immunoprecipitated (IP) with anti-GFP, anti-liprin-α1, or control IgG; aliquots of the two lysates used for IP are shown on the right. FL, full length liprin-α1; N, liprin-N; ΔN, liprin-ΔN; ΔN1, liprin-ΔN1; ΔN2, liprin-ΔN2; 1–670, Liprin-1-670; 1–517, Liprin-1-517. Blots in panels (c,d) have been cropped, and full blots are presented in Supplementary Fig. S8a.
Figure 2
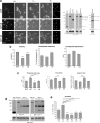
Figure 2. Liprin-N interferes with tumor cell motility and invasiveness.
(a) Frames from time-lapse of MDA-231 cells transfected with GFP-tagged constructs. Cells were visualized after transfection on fibronectin-coated substrates. Numbers indicate transfected GFP-positive cells (left panel), at the beginning and end of 3 h monitoring. The last column on the right shows the tracks (3 h) of the cells indicated by respective numbers on the left (NB: tracks are oriented differently from the cells shown in the time frames). Scale bar, 50 μm. Right: blots for relative levels of transfected constructs with respect to endogenous liprin-α1: intensity of GFP-Liprin-N and GFP-Liprin-ΔN were respectively about 4-fold and 6-fold stronger than endogenous liprin-α1. (b) MDA-231 cells transfected with the indicated constructs were quantified for speed of migration (left; n of cells is 469 for GFP; 398 for liprin-N; 434 for liprin-ΔN); for frequency (centre) and duration (right) of lamellipodia (n = 15 cells per condition). (c) Influence of liprin constructs on the morphology of transfected cells freely migrating on fibronectin. Projected cell area (left graph), circularity (centre) and aspect ratio (right) were measured as described in the Methods (n = 60–66 cells per experimental condition). In the right graph, A is the projected cell area, p is the cell perimeter. (d) Immunoblotting with anti-GFP (left), anti-liprin-α1 (right), and anti-tubulin (bottom) antibodies on lysates from the indicated cell clones obtained by transfection and selection of MDA-231 cells with the indicated constructs. Right blot: two different anti-liprin-α1 antibodies were used: the antibody used for the left filter (from Santa Cruz) was less efficient, and used to identify liprin-ΔN that lacks the epitope recognized by the antibody from Proteintech, used on left filter. (e) Matrigel invasion assays performed with cell lines stably expressing the indicated constructs, as detailed in the Methods. Bars in (b,c,e) are means ± s.e.m.; significant differences detected by the Student t-test: * and °p < 0.05; ** and °°p < 0.005; *** and °°°p < 0.0005; asterisks (*) refer to differences with respect to GFP-transfected cells; circles (°) refer to differences with respect to GFP-liprin-α1 (WT). Blots in (a,d) are cropped; see full blots in Supplementary Fig. S8b.
Figure 3
Figure 3. Effects of different liprin-α1 constructs on the subcellular localization of ERC1.
(a) Laser scanning confocal microscope images of MDA-231 cells plated on fibronectin. Left is a merge of the confocal image (green) and phase contrast to show the shape of the cells transfected with the indicated GFP-tagged liprin-α1 construct. Graph on the right: quantification of transfected cells with diffuse (GFP-positive) signal or with signal concentrated at the cell edge (n = 31–49 cells from 3 independent experiments). ***P < 0.0001 by the χ2 test. (b) Cells were seeded on fibronectin-coated coverslips, fixed and processed for immunofluorescence to reveal the indicated endogenous proteins. Images were acquired at UltraViewer spinning disk confocal microscope. Scale bar 20 μm. (c) TIRF microscopy of cells cotransfected with the indicated GFP-tagged liprin-α1 constructs (green) and mCherry-ERC1 (red). The upper row shows the merge of green (second row) and red (bottom row) channels. Scale bar, 20 μm. (d) TIRF microscopy of cells transfected with the indicated GFP-tagged liprin-α1 constructs (green) and siRNAs, immunostained to detect endogenous ERC1 (red). From left: the first column shows the merged TIRF images at the bottom of the cells (90 nm); the second and third rows show the distributions of the transfected liprin-α1 constructs and of endogenous ERC1, respectively; the last two columns to the right show 4-fold enlargements of the protrusions highlighted in the first column. Scale bars, 20 μm.
Figure 4
Figure 4. ERC1 and liprin dimerization regulate the morphology and dynamics of peripheral focal adhesions in migrating cells.
(a) Left: depletion of ERC1 by two siRNAs in lysates (50 μg). Right: Colour-coded maximal-intensity projection from 1 h time-lapse series of mCherry-Zyxin. White indicates static adhesions. Scale bar, 20 μm. Full blots are presented in Supplementary Fig. S8c. (b) Bars are means ± s.e.m. (c) Focal adhesions lifespan (n = 43–59) from cells prepared as in (b). (d) Confocal frames from migrating MDA-231 cells (arrows) cotransfected with mCherry-Zyxin and siRNA. Scale bar, 10 μm. Bottom: cell boundaries outlined in blue. Scale bar, 5 μm. (e) Silencing of ERC1 decreased the area occupied by adhesions at the cell periphery. The area of protruding cell edge occupied by adhesions was calculated on thresholded 20 × 10 μm peripheral regions. Bars are normalized means ± s.e.m. (n = 14–18 protrusions). On the right is the distribution of the values (n = 14 protrusions per experimental condition). (f–j) Liprin-N and liprin-ΔN mutants perturb focal adhesion dynamics. (f) Color-coded maximal-intensity projection of the mCherry-Zyxin signal from 1 h acquisition of cells expressing mCherry-Zyxin and GFP-tagged mutants. Scale bar 10 μm. (g) Bars are means ± s.e.m. of rate of assembly (n = 32–87 events), disassembly (n = 39–70 events), and lifespan of focal adhesions (n = 60–120 focal adhesions). (h) Adhesion lifespan at cell periphery (n = 50–58 adhesions). (i) Left: means of focal adhesions/frame (average from different frames; 60 frames per cells; n = 72–177 adhesions from 3–4 experiments). Right: normalized ratio between the area of peripheral focal adhesions and the total cell area (n = 171–296 focal adhesions from 2–3 independent experiments. (j) Quantification of the assembly, disassembly, and halt events per focal adhesion during 60 minutes acquisition of MDA-231 cells transfected with the indicated mutants. Bars show means ± s.e.m. normalized to control (GFP) values (n =  60–118 focal adhesions from 3 independent experiments). In (g,i,j) values significantly different from controls (GFP) are indicated by asterisks, while values significantly different from GFP-Liprin-α1 (WT) are indicated by circles. °, *P < 0.05; °°, **P < 0.005; °°°, ***P < 0.0005; n.s., no significant difference with control. Student’s t-test.
Figure 5
Figure 5. Colocalization of ERC1 with active integrins at sites lacking cytoplasmic focal adhesion proteins.
(a) Confocal microscopy showing the immunolocalization of endogenous active β1 integrins (by mAb 9EG7), ERC1, and paxillin. Scale bar, 20 μm. The white arrow indicates the focal adhesion area enlarged in the images underneath. Scale bar, 2 μm. (b,c) TIRF images of HeLa cells immunostained for the indicated endogenous proteins. Scale bar, 20 μm. White arrow indicates the area shown in the 5-fold enlargement underneath. Scale bar, 4 μm. (d) Example of a TIRF image from the peripheral area of an MDA-231 cell on fibronectin used for the analysis of the colocalization between endogenous active β1 integrins, focal adhesion marker vinculin, and ERC1. The 3 channels from the merge on the left are shown as reversed images showing the localization of each protein. The last panel on the right shows the distribution of the triple colocalization within the selected area. Dotted rectangles show two examples of areas with little or no triple colocalization. Scale bar 2 μm. (e) Quantitative analysis of fluorescence intensity in the proximity of vinculin-positive focal adhesions on TIRF images of MDA-231 cells. Representations of the single, double and triple localization of the 3 markers (vinculin, ERC1, active β1) with respect to total ERC1 (left graphs), total active β1 (central graphs), and total vinculin signal (right graphs); n = 22 focal adhesions from 4 cells.
Figure 6
Figure 6. Colocalization of Rab7 with internalized active integrins at protrusions.
Confocal microscopy of MDA-231 cells plated on fibronectin and incubated for 1 or 2 h with 1.25 μg/ml of 9EG7 mAb recognizing active β1 integrins. After fixation, cells were immunostained for endogenous Rab7, and then with secondary antibodies to reveal also the internalized 9EG7 mAb. Scale bars, 20 μm. White arrows and the dotted rectangle show examples of protrusions, enlarged in the image underneath, where the overlap between Rab7 and active integrin signals is evident. Scale bar 5 μm.
Figure 7
Figure 7. ERC1 and liprin-α1 regulate the distribution of focal adhesions and Rab7-positive endosomes at the cell periphery.
(a) Frame from a time-lapse (TIRF, see Supplementary movie S5) of COS7 cell cotransfected with GFP-Rab7, mCherryERC1 and cerulean-Zyxin. Below, 4-fold enlargement of the area indicated by the arrow: the composite distribution of the 3 markers around the zyxin-positive focal adhesions is shown. Scale bar, 20 μm. (b) Frames from time lapse at the TIRF microscope (see Supplementary movie S6) from the peripheral area of a cell transfected as in (a), showing the dynamic behavior of the 3 markers. Scale bar, 4 μm. (c) COS7 cells were plated on fibronectin, cotransfected with GFP-Rab7, mCherry-Zyxin and indicated siRNA. TIRF images were used for quantification. Scale bar, 20 μm. (d) Projected cell area (n = 35–41 cells from 3 independent experiments) normalized on control cells (siLuc). (e) Ratio between Rab7-positive area and projected cell area (pixels/pixels). (f) Ratio between zyxin-positive focal adhesion area and projected cell area (pixels/pixels). (g) Ratio between number of zyxin-positive focal adhesions and projected cell area (n = 36–43 from 3 experiments). (h) Intensity of Rab7-positive signal per focal adhesion at cell periphery (n = 28–41) or in central area of the cell (n = 17–28). (i) TIRF images of COS7 cells cotransfected with mCherry-Zyxin, GFP-Rab6, and siRNAs. Scale bar, 20 μm. (j) Ratio between Rab6-positive area and projected cell area (pixels/pixels) (n = 34–41 from 3 experiments). Bars in (dh,j) are normalized means ± s.e.m. *P < 0.05; **P < 0.005; ***P < 0.0005; n.s., no significant difference with control.
Figure 8
Figure 8. Model for the role of the liprin-α1 and ERC1 on focal adhesion turnover.
During migration, liprin-α1 and ERC1 are recruited together at focal adhesions near the cell edge (a) displacing its cytoplasmic components (b), to facilitate the internalization of active integrins into Rab7-positive endosomes and promote focal adhesion tunover and protrusion (c). A defect in the recruitment of liprin/ERC functional complexes prevents efficient focal adhesion disassembly inhibiting protrusion.

Similar articles

Cited by

References

    1. de Curtis I. & Meldolesi J. Cell surface dynamics - how Rho GTPases orchestrate the interplay between the plasma membrane and the cortical cytoskeleton. J. Cell Sci. 125, 4435–4444 (2012). - PubMed
    1. Astro V., Asperti C., Cangi M. G., Doglioni C. & de Curtis I. Liprin-α1 regulates breast cancer cell invasion by affecting cell motility, invadopodia and extracellular matrix degradation. Oncogene 30, 1841–1849 (2011). - PubMed
    1. Chiaretti S. & de Curtis I. Role of Liprins in the Regulation of Tumor Cell Motility and Invasion. Curr. Cancer Drug Targets 16, 238–248 (2016). - PubMed
    1. Asperti C. et al.. Biochemical and functional characterization of the interaction between liprin-α1 and GIT1: implications for the regulation of cell motility. PLoS One 6, e20757 (2011). - PMC - PubMed
    1. Wei Z. et al.. Liprin-mediated large signaling complex organization revealed by the liprin-α/CASK and liprin-α/liprin-β complex structures. Mol. Cell 43, 586–598 (2011). - PubMed

LinkOut - more resources