. 2016 Dec;112(3):677-688.
doi: 10.1093/cvr/cvw209. Epub 2016 Sep 22.

Endothelial cell-derived pentraxin 3 limits the vasoreparative therapeutic potential of circulating angiogenic cells

Affiliations

Endothelial cell-derived pentraxin 3 limits the vasoreparative therapeutic potential of circulating angiogenic cells

Christina L O'Neill et al. Cardiovasc Res. 2016 Dec.

Abstract

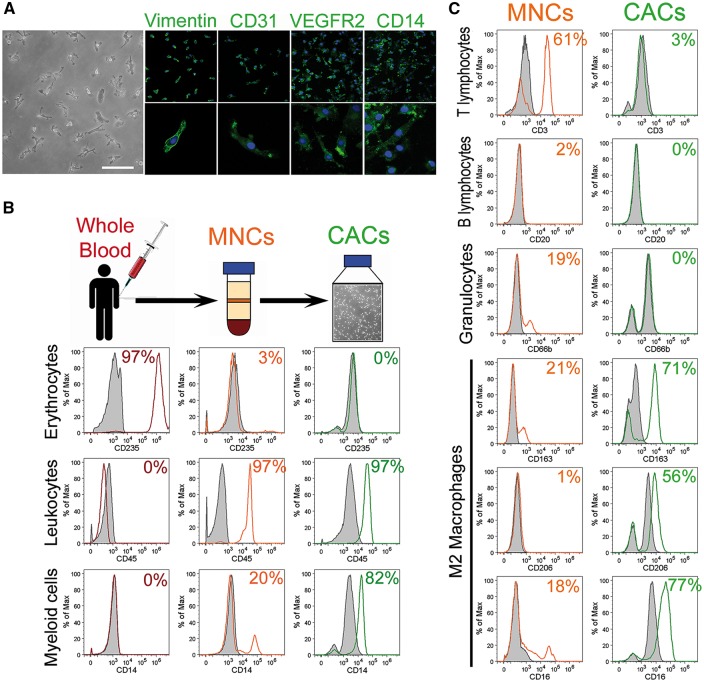
Aims: Circulating angiogenic cells (CACs) promote revascularization of ischaemic tissues although their underlying mechanism of action and the consequences of delivering varying number of these cells for therapy remain unknown. This study investigates molecular mechanisms underpinning CAC modulation of blood vessel formation.

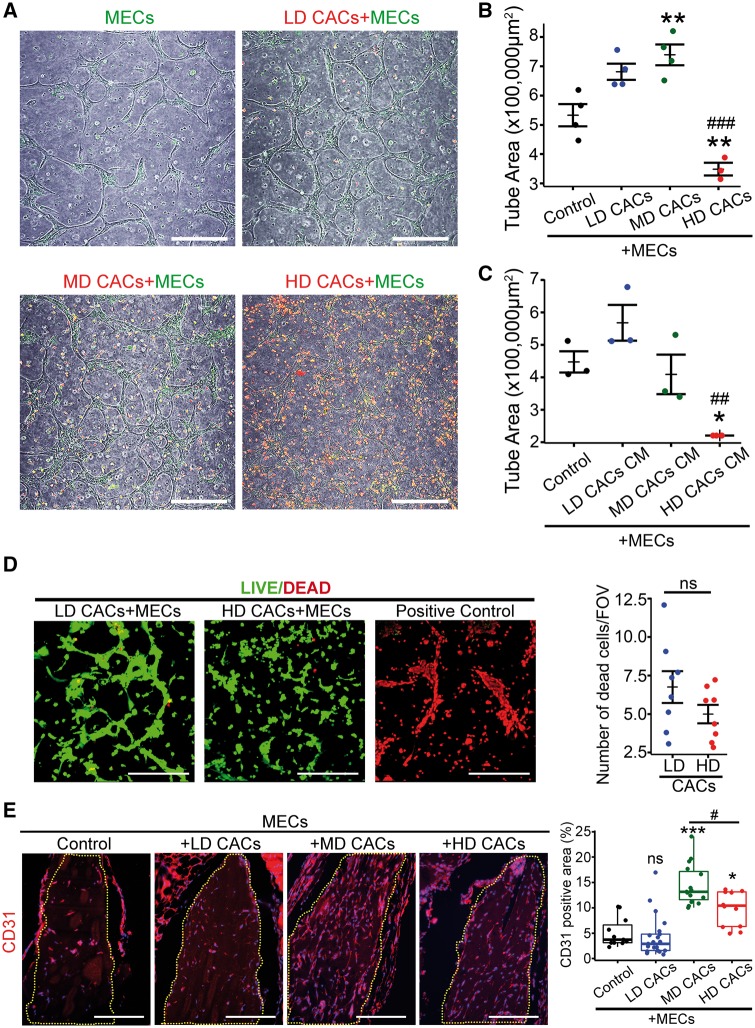
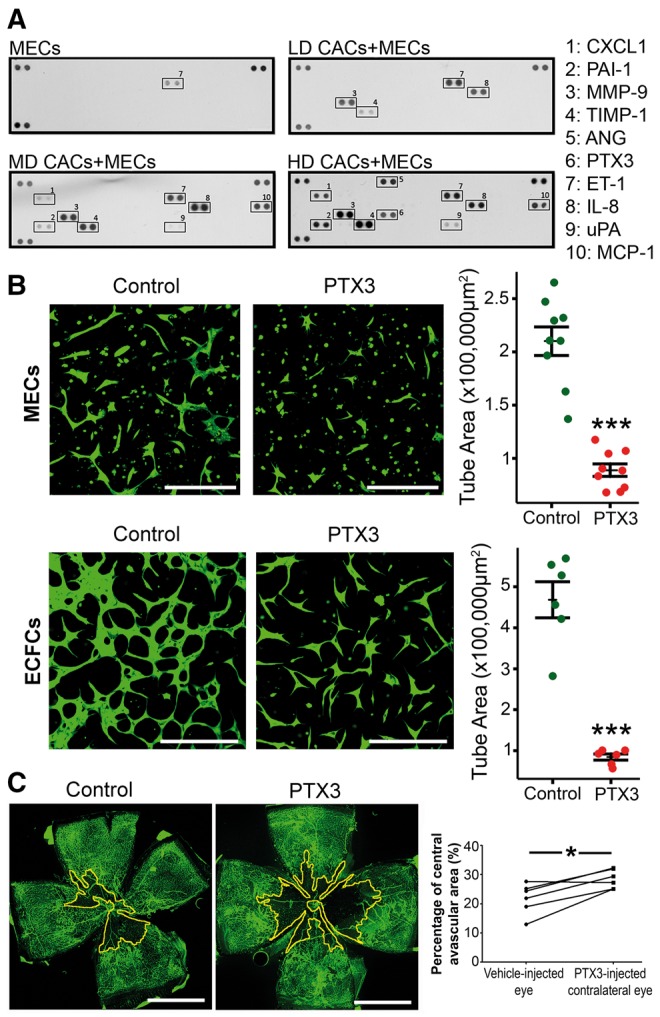
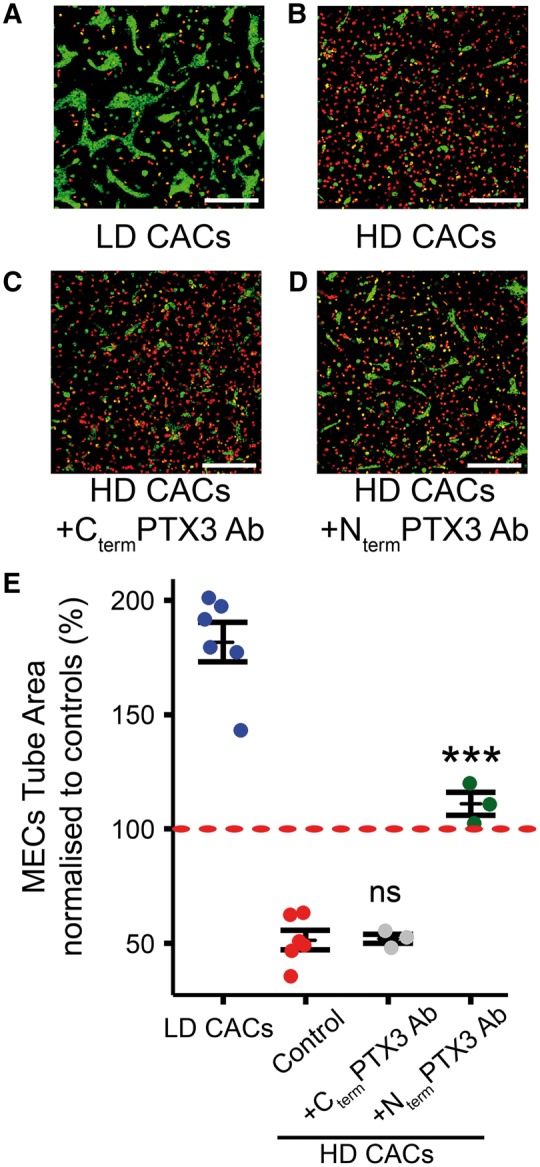
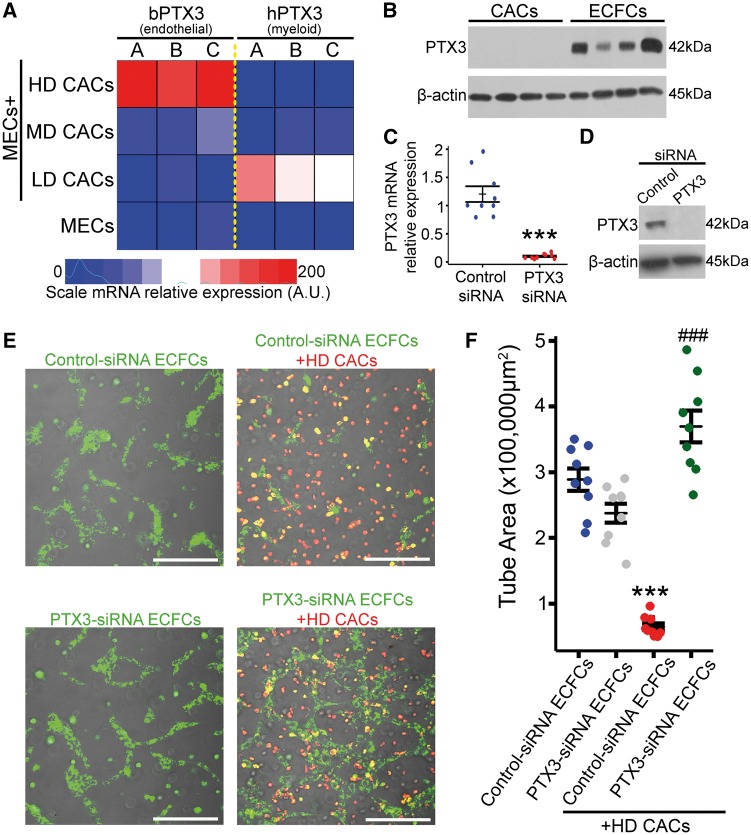
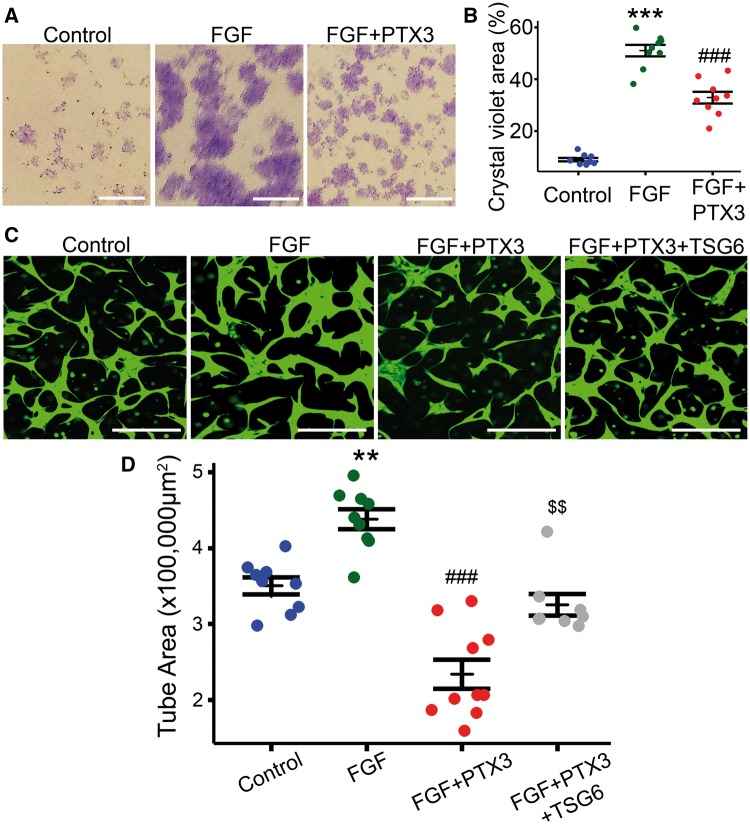
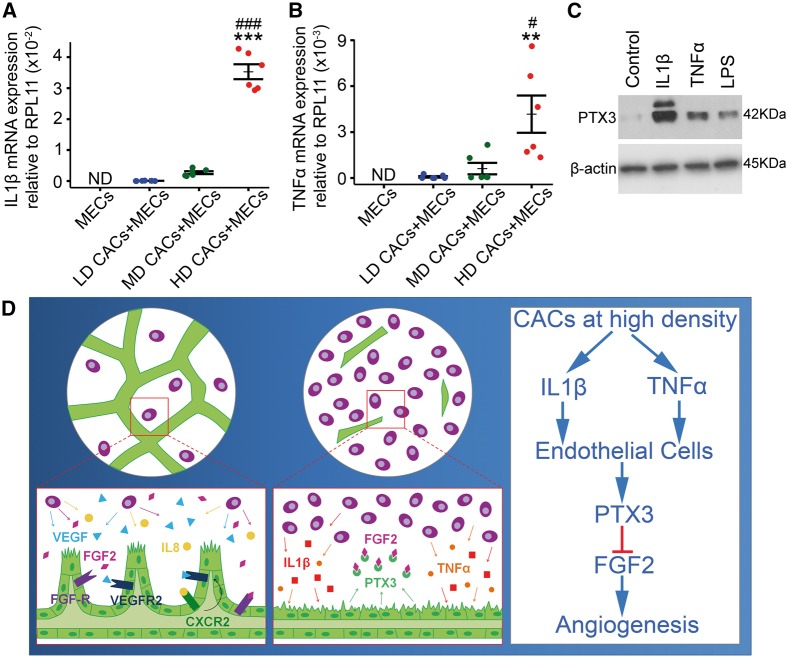
Methods and results: CACs at low (2 × 10⁵ cells/mL) and mid (2 × 10⁶ cells/mL) cellular densities significantly enhanced endothelial cell tube formation in vitro, while high density (HD) CACs (2 × 10⁷ cells/mL) significantly inhibited this angiogenic process. In vivo, Matrigel-based angiogenesis assays confirmed mid-density CACs as pro-angiogenic and HD CACs as anti-angiogenic. Secretome characterization of CAC-EC conditioned media identified pentraxin 3 (PTX3) as only present in the HD CAC-EC co-culture. Recombinant PTX3 inhibited endothelial tube formation in vitro and in vivo. Importantly, our data revealed that the anti-angiogenic effect observed in HD CAC-EC co-cultures was significantly abrogated when PTX3 bioactivity was blocked using neutralizing antibodies or PTX3 siRNA in endothelial cells. We show evidence for an endothelial source of PTX3, triggered by exposure to HD CACs. In addition, we confirmed that PTX3 inhibits fibroblast growth factor (FGF) 2-mediated angiogenesis, and that the PTX3 N-terminus, containing the FGF-binding site, is responsible for such anti-angiogenic effects.

Conclusion: Endothelium, when exposed to HD CACs, releases PTX3 which markedly impairs the vascular regenerative response in an autocrine manner. Therefore, CAC density and accompanying release of angiocrine PTX3 are critical considerations when using these cells as a cell therapy for ischaemic disease.

Keywords: Cell therapy; Circulating angiogenic cell; Ischaemia; PTX3; Vascular repair.


Figures

Figure 1
Figure 1
CACs isolated from human blood are enriched for myeloid cells. (A) Phase contrast image of CACs at Day 7 of culture. Scale bar 100 μm. Representative immunocytochemistry images for Vimentin, CD31, VEGFR2, and CD14 in green. Nuclei stained with DAPI in blue. Magnification ×10 is shown in upper panel and ×40 in lower panel. (B) Flow cytometry immunophenotyping of whole blood, MNCs, and CACs. Red histograms show whole blood cells, orange histograms MNCs and green histograms CACs. Respective isotype controls shown as grey histograms. (C) Flow cytometry quantification of cell surface marker expression for T & B lymphocytes, granulocytes, and macrophages on MNCs and CACs. Orange histograms represent MNCs and green histograms CACs. Respective isotype controls shown as grey histograms.
Figure 2
Figure 2
The angiogenic potential of CACs is affected by their cellular density. (A) Representative images of green-labelled MECs and red-labelled CACs co-culture after 72 h in the 3D Matrigel tube formation assay. Scale bar 250 μm. (B) Quantification and statistical analysis of tube areas for experimental groups depicted in A (n = 3–4, one way-ANOVA, **P < 0.01 vs. control, ###P < 0.001 vs. MD-CACs). (C) Evaluation of the effect for the CACs CM at different densities on MEC tube forming capacity (n = 3, one-way ANOVA, *P < 0.05 vs. control, ##P < 0.01 vs. LD-CACs). (D) Representative images for cell death assessment using the LIVE/DEAD kit. Dead cells shown in red by EthD-1 and live cells in green by calcein. Scale bar 250 μm. Quantification of number of dead cells per field of vision (FOV), (n = 8; unpaired t-test; ns , not significant). (E) Representative images of paraffin sections from the in vivo Matrigel angiogenesis model in nude mice stained for the endothelial marker CD31 in red. Nuclei are stained in blue with DAPI. Matrigel implants are surrounded by yellow dotted line. Scale bar 250 μm. Quantification and statistical analysis of CD31 positive areas within Matrigel implants (data visualized as boxplots, n = 11–21, one-way ANOVA, ***P < 0.001 vs. control, *P < 0.05 vs. control; ns, not significant vs. control; #P < 0.05 vs. MD-CACs).
Figure 3
Figure 3
PTX3 is identified exclusively in the HD-CACs + MECs co-culture and has anti-angiogenic function. (A) Proteome profiler for CM characterization. Positive control protein spots are shown in top left, top right, and bottom left corners. Negative control spots are on the bottom right corner (n = 2). (B) Representative fluorescent microscope images for the in vitro Matrigel-based 3D tube formation assay with bovine MECs or human ECFCs labelled in green with Calcein, with and without exposure to 500 ng/mL PTX3. Scale bar 250 μm. Statistical comparison of tube areas between groups (n = 6–9, unpaired t-test, ***P < 0.001 vs. control). (C) Representative flat-mounted retinas of C57BL/6 mice that received an intravitreal injection of 1 μL PTX3 at 100 ng/mL or 1 µL of vehicle. Lectin staining in green identifies retinal vasculature. Avascular regions are surrounded by a yellow line. Scale bar 1 mm. Quantification of avascular areas (n = 6, paired t-test, *P < 0.05 comparing vehicle-treated and PTX3-treated eyes).
Figure 4
Figure 4
PTX3 mediates HD-CACs anti-angiogenic effects on MECs. (A) Representative image for 3D Matrigel tubulogenesis model showing LD CACs in red and MECs in green. (B) Representative image showing HD CACs in red inhibited MECs tubule formation. (C and D) PTX3 antibodies targeting the C-terminus (Cterm) and the N-terminus (Nterm) were added to the co-culture system. Scale bars 300 μm. (E) Quantification of MEC tube area after normalizing to MEC control (red dashed line at 100%) (Data visualized as stripcharts n = 3–6; one-way ANOVA; ***P < 0.001; ns, not significant).
Figure 5
Figure 5
PTX3 produced by endothelial cells in response to HD-CACs acts in an autocrine anti-angiogenic manner. (A) PTX3 expression analysis using qRT-PCR and bovine or human-specific primers, visualized in a heatmap for three biological replicates. (B) Protein expression analysis in human cell lysates from CACs and ECFCs for four biological replicates. (C) RT-qPCR to evaluate PTX3-siRNA knockdown efficiency (n = 9, one-way ANOVA, ***P < 0.001). (D) Western blot to assess level of PTX3-siRNA knockdown in ECFCs. (E) Representative images of in vitro 3D Matrigel-based tube formation assay showing CACs in red and ECFCs in green. Scale bars 300 μm (F) Quantification and statistical analysis of ECFC tube areas (n = 9, one-way ANOVA, data visualized as a stripchart, ***P < 0.001 vs. control siRNA-ECFCs, ###P < 0.001 vs. control siRNA-ECFCs + HD-CACs).
Figure 6
Figure 6
PTX3 impairs FGF2-mediated endothelial cell function. (A) Representative images from clonogenic assay. ECFC colonies were stained with crystal violet. Scale bars 250 μm. (B) Quantification and statistical analysis of FGF2 and PTX3 effects on ECFC clonogenic potential quantified as the percentage (%) of total surface area covered by crystal violet staining (n = 9, one-way ANOVA, data visualized as a stripchart, ***P < 0.001 vs. control, ###P < 0.001 vs. FGF). (C) Representative images for 3D Matrigel in vitro model showing tubule formation by ECFCs in green. FGF2 (5 ng/mL), human recombinant PTX3 (500 ng/mL) and TSG6 (1 µg/mL). Scale bars 200 μm. (D) Quantification of tube areas (n = 8–10, one-way ANOVA, data visualized as a stripchart, **P < 0.01 vs. control, ###P < 0.001 vs. FGF, $$P < 0.01 vs. FGF + PTX3).
Figure 7
Figure 7
CACs at high-cellular density induce upregulation of IL1β and TNFα which increase PTX3 expression in endothelial cells. (A) Evaluation of IL1β expression by qRT-PCR in co-cultures. ND, not detectable (n = 6, one way-ANOVA). (B) TNFα expression assessed by qRT-PCR. ND, not detectable (n = 3, one-way ANOVA). Data expressed as mean ± SEM. ***P < 0.001 vs. LD-CACs + MECs, ###P < 0.001 vs. MD-CACs + MECs, **P < 0.01 vs. LD-CACs + MECs, and #P < 0.05 vs. MD-CACs + MECs. (C) Western blot for PTX3 expression in ECFCs treated for 5 h with 20 ng/mL IL1β, or 40 ng/mL TNFα, or 500 ng/mL LPS. (D) Schematic diagram for proposed mechanistic model: HD-CACs upregulate expression of inflammatory cytokines IL1β and TNFα, which induces endothelial expression and release of PTX3 that ultimately impairs FGF2-induced angiogenesis.

References

    1. de Jong R, Houtgraaf JH, Samiei S, Boersma E, Duckers HJ. Intracoronary stem cell infusion after acute myocardial infarction: a meta-analysis and update on clinical trials. Circ Cardiovasc Interv 2014;7:156–167. - PubMed
    1. Fadini GP, Agostini C, Avogaro A. Autologous stem cell therapy for peripheral arterial disease meta-analysis and systematic review of the literature. Atherosclerosis 2010;209:10–17. - PubMed
    1. Medina RJ, O'Neill CL, Sweeney M, Guduric-Fuchs J, Gardiner TA, Simpson DA, Stitt AW. Molecular analysis of endothelial progenitor cell (EPC) subtypes reveals two distinct cell populations with different identities. BMC Med Genomics 2010;3:18. - PMC - PubMed
    1. Medina RJ, O'Neill CL, O'Doherty TM, Knott H, Guduric-Fuchs J, Gardiner TA, Stitt AW. Myeloid angiogenic cells act as alternative M2 macrophages and modulate angiogenesis through interleukin-8. Mol Med 2011;17:1045–1055. - PMC - PubMed
    1. Taljaard M, Ward MR, Kutryk MJ, Courtman DW, Camack NJ, Goodman SG, Parker TG, Dick AJ, Galipeau J, Stewart DJ. Rationale and design of Enhanced Angiogenic Cell Therapy in Acute Myocardial Infarction (ENACT-AMI): the first randomized placebo-controlled trial of enhanced progenitor cell therapy for acute myocardial infarction. Am Heart J 2010;159:354–360. - PubMed

Publication types

MeSH terms