. 2016 Sep 22;18(1):62.
doi: 10.1186/s12968-016-0275-9.

Magnetic resonance imaging phantoms for quality-control of myocardial T1 and ECV mapping: specific formulation, long-term stability and variation with heart rate and temperature

Affiliations

Magnetic resonance imaging phantoms for quality-control of myocardial T1 and ECV mapping: specific formulation, long-term stability and variation with heart rate and temperature

Vassilios S Vassiliou et al. J Cardiovasc Magn Reson. .

Abstract

Background: Magnetic resonance imaging (MRI) phantoms are routinely used for quality assurance in MRI centres; however their long term stability for verification of myocardial T1/ extracellular volume fraction (ECV) mapping has never been investigated.

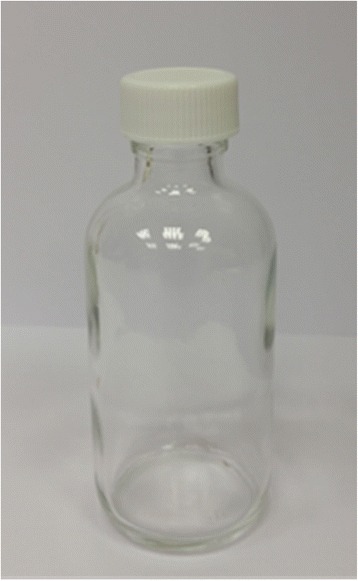
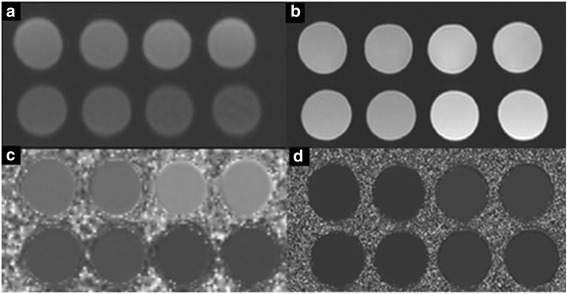
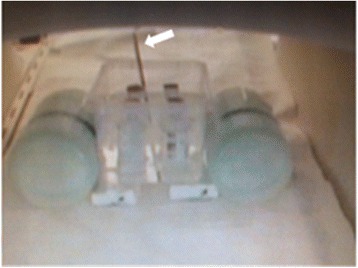
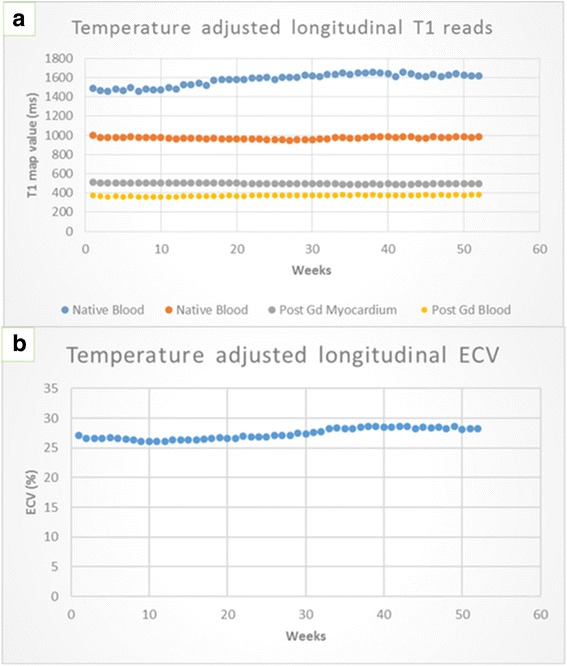
Methods: Nickel-chloride agarose gel phantoms were formulated in a reproducible laboratory procedure to mimic blood and myocardial T1 and T2 values, native and late after Gadolinium administration as used in T1/ECV mapping. The phantoms were imaged weekly with an 11 heart beat MOLLI sequence for T1 and long TR spin-echo sequences for T2, in a carefully controlled reproducible manner for 12 months.

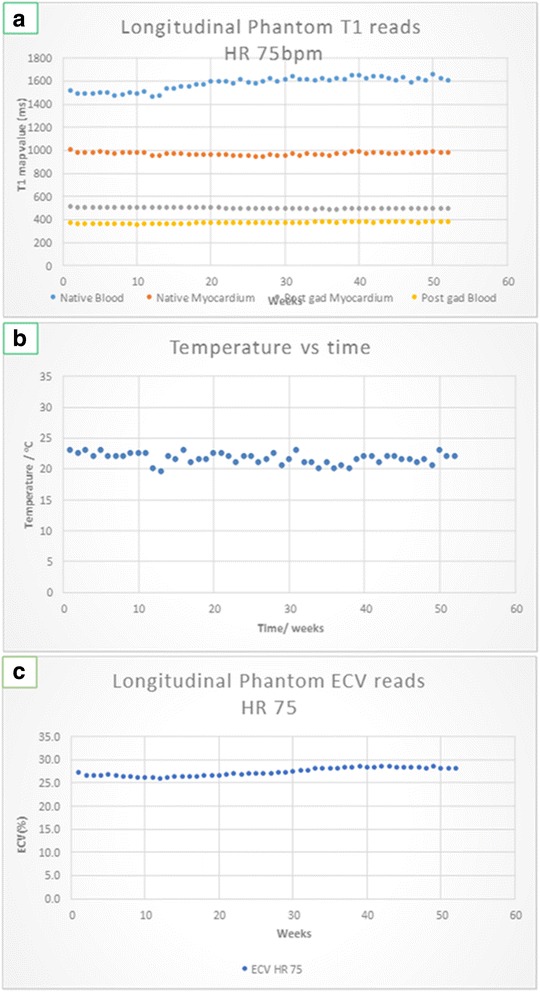
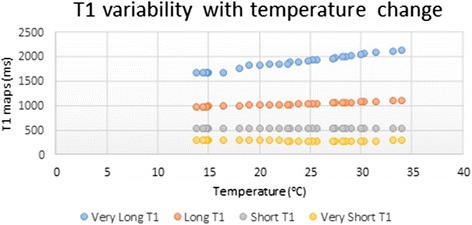
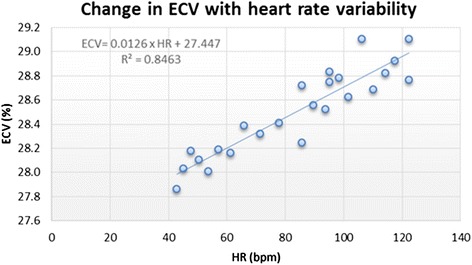
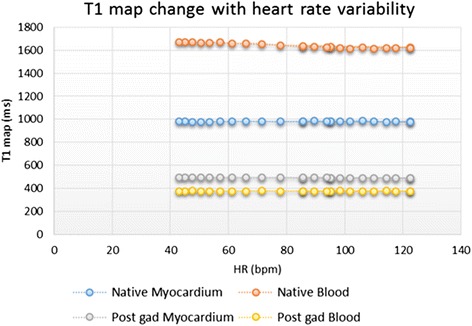
Results: There were only small relative changes seen in all the native and post gadolinium T1 values (up to 9.0 % maximal relative change in T1 values) or phantom ECV (up to 8.3 % maximal relative change of ECV, up to 2.2 % maximal absolute change in ECV) during this period. All native and post gadolinium T2 values remained stable over time with <2 % change. Temperature sensitivity testing showed MOLLI T1 values in the long T1 phantoms increasing by 23.9 ms per degree increase and short T1 phantoms increasing by 0.3 ms per degree increase. There was a small absolute increase in ECV of 0.069 % (~0.22 % relative increase in ECV) per degree increase. Variation in heart rate testing showed a 0.13 % absolute increase in ECV (~0.45 % relative increase in ECV) per 10 heart rate increase.

Conclusions: These are the first phantoms reported in the literature modeling T1 and T2 values for blood and myocardium specifically for the T1mapping/ECV mapping application, with stability tested rigorously over a 12 month period. This work has significant implications for the utility of such phantoms in improving the accuracy of serial scans for myocardial tissue characterisation by T1 mapping methods and in multicentre work.

Keywords: Agarose; Nickel; Phantoms; Stability; T1 mapping.


Figures

Fig. 1
Fig. 1
Title: A 60mls narrow neck bottle used. Legend: The 60mls narrow-neck bottles used (Fisherbrand TM Clear Soda Lime Glass Boston Round Narrow Mouth Bottles with Polyvinyl Cap) to minimise gel-to-environment exposure by reducing the contact surface area. These were considered more likely to deliver stability than thin-wall tubes with poorly-fitting broad caps
Fig. 2
Fig. 2
Title: Post processing T1 and T2 images. Each phantom mixture was included twice giving a total of four different mixtures. Legend: Panel a is the original inversion recovery image, panel b is the spin echo magnitude image. Panels c and d represent the final maps; panel C is the T1 map and panel D is the T2 map. The ROI mean values were taken well within the phantoms away from edge-ringing artefacts such as Gibbs artefact [26] using CMR Tools
Fig. 3
Fig. 3
Title: The phantom arrangement during the water bath. Legend: Image showing the phantoms in the water bath, the mercury thermometer (arrow) stabilised in the water bath and the preparation inside the MRI scanner
Fig. 4
Fig. 4
Title: Longitudinal imaging for T1 values and variation in temperature. Legend: Panel a longitudinal stability without temperature correction for native and post contrast myocardial and blood phantom T1 values. The phantoms corresponding to native blood T1 values showed a slow drift, whist the remaining phantoms corresponding to native myocardium and post-contrast blood and myocardium remained relatively stable. Panel b weekly temperature variation of the MRI room. Panel c fusing the individual variables from panel a , and a haematocrit of 0.425 a Phantom ECV was calculated
Fig. 5
Fig. 5
Title: Temperature adjusted T1 values. Legend: Longitudinal follow-up showing adjusted values for T1 (panel a) and ECV (panel b) incorporating the small temperature variation. The overall results however, of a small drift in the native blood T1 phantoms remained unchanged
Fig. 6
Fig. 6
Title: T1 variation with temperature. Legend: Effect of temperature variation on native and post-Gd myocardial and blood T1. This effect appears to predominantly affect the longer T1 values
Fig. 7
Fig. 7
Title: ECV change with heart rate variation. Legend: Graph demonstrating the linear relationship of between HR change and change in ECV. This change was overall small with a 0.13 % absolute increase per 10 heart beat increase
Fig. 8
Fig. 8
Title: Change in T1 values with heart rate variation. Legend: The effect of heart rate variation in phantoms modeling native and post-Gd myocardium and blood

Similar articles

Cited by

References

    1. Messroghli DR, et al. Modified Look-Locker inversion recovery (MOLLI) for high-resolution T1 mapping of the heart. Magn Reson Med : off j Soc Magn Reson Med / Soc Magn Reson Med. 2004;52(1):141–146. doi: 10.1002/mrm.20110. - DOI - PubMed
    1. Rogers T, et al. Standardization of T1 measurements with MOLLI in differentiation between health and disease—the ConSept study. J Cardiovasc Magn Reson off j Soc Cardiovasc Magn Reson. 2013;15:78. - PMC - PubMed
    1. Hinojar R, Varma N, et al. T1 Mapping in Discrimination of Hypertrophic Phenotypes: Hypertensive Heart Disease and Hypertrophic Cardiomyopathy: Findings From the International T1 Multicenter Cardiovascular Magnetic Resonance Study. Circ Cardiovasc Imaging. 2015;8:e003285. - PubMed
    1. Karamitsos TD, et al. Noncontrast T1 mapping for the diagnosis of cardiac amyloidosis. JACC Cardiovasc Imaging. 2013;6(4):488–497. doi: 10.1016/j.jcmg.2012.11.013. - DOI - PubMed
    1. Pica S, et al. Reproducibility of native myocardial T1 mapping in the assessment of Fabry disease and its role in early detection of cardiac involvement by cardiovascular magnetic resonance. J Cardiovasc Magn Reson off j Soc Cardiovasc Magn Reson. 2014;16:99. - PMC - PubMed