. 2016 Sep 22;18(1):58.
doi: 10.1186/s12968-016-0280-z.

A medical device-grade T1 and ECV phantom for global T1 mapping quality assurance-the T1 Mapping and ECV Standardization in cardiovascular magnetic resonance (T1MES) program

Affiliations

A medical device-grade T1 and ECV phantom for global T1 mapping quality assurance-the T1 Mapping and ECV Standardization in cardiovascular magnetic resonance (T1MES) program

Gabriella Captur et al. J Cardiovasc Magn Reson. .

Abstract

Background: T1 mapping and extracellular volume (ECV) have the potential to guide patient care and serve as surrogate end-points in clinical trials, but measurements differ between cardiovascular magnetic resonance (CMR) scanners and pulse sequences. To help deliver T1 mapping to global clinical care, we developed a phantom-based quality assurance (QA) system for verification of measurement stability over time at individual sites, with further aims of generalization of results across sites, vendor systems, software versions and imaging sequences. We thus created T1MES: The T1 Mapping and ECV Standardization Program.

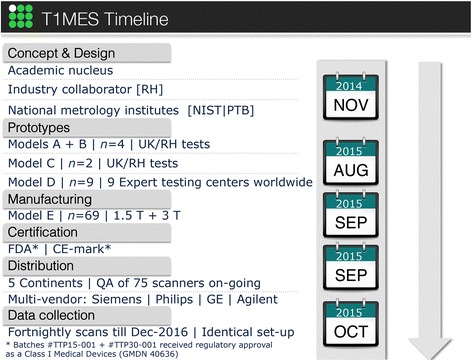
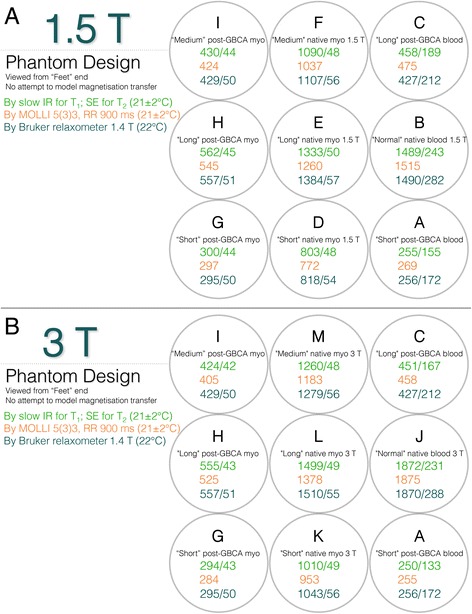
Methods: A design collaboration consisting of a specialist MRI small-medium enterprise, clinicians, physicists and national metrology institutes was formed. A phantom was designed covering clinically relevant ranges of T1 and T2 in blood and myocardium, pre and post-contrast, for 1.5 T and 3 T. Reproducible mass manufacture was established. The device received regulatory clearance by the Food and Drug Administration (FDA) and Conformité Européene (CE) marking.

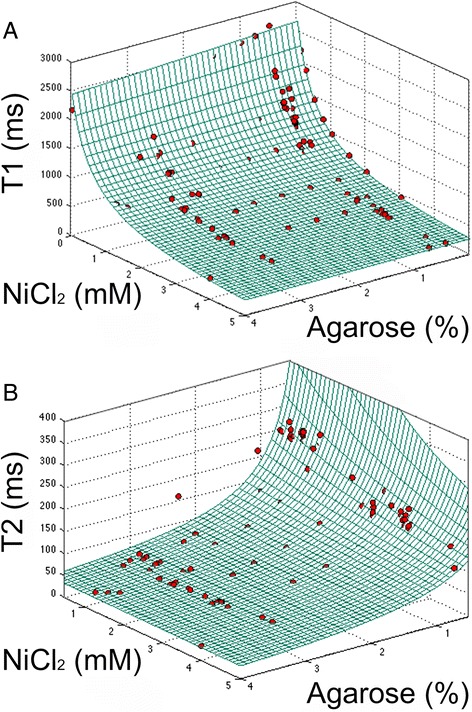
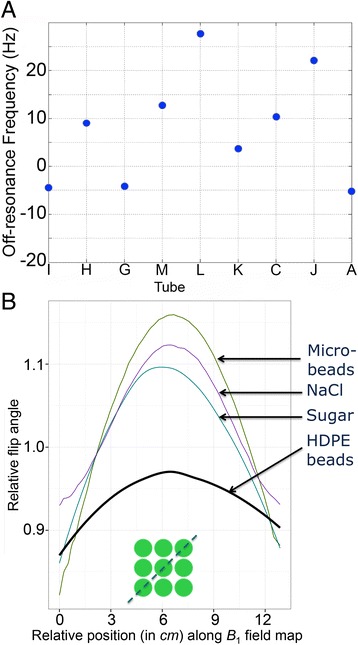
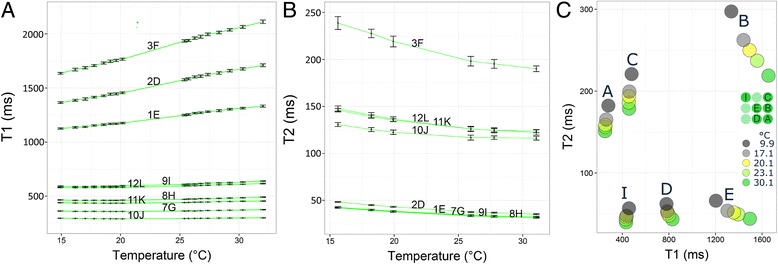
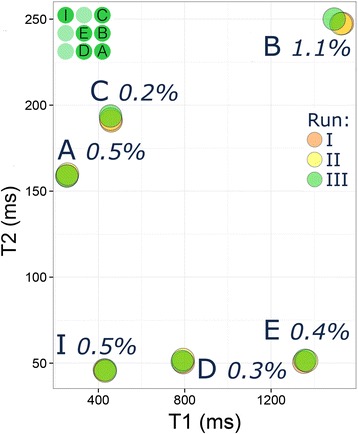
Results: The T1MES phantom is an agarose gel-based phantom using nickel chloride as the paramagnetic relaxation modifier. It was reproducibly specified and mass-produced with a rigorously repeatable process. Each phantom contains nine differently-doped agarose gel tubes embedded in a gel/beads matrix. Phantoms were free of air bubbles and susceptibility artifacts at both field strengths and T1 maps were free from off-resonance artifacts. The incorporation of high-density polyethylene beads in the main gel fill was effective at flattening the B 1 field. T1 and T2 values measured in T1MES showed coefficients of variation of 1 % or less between repeat scans indicating good short-term reproducibility. Temperature dependency experiments confirmed that over the range 15-30 °C the short-T1 tubes were more stable with temperature than the long-T1 tubes. A batch of 69 phantoms was mass-produced with random sampling of ten of these showing coefficients of variations for T1 of 0.64 ± 0.45 % and 0.49 ± 0.34 % at 1.5 T and 3 T respectively.

Conclusion: The T1MES program has developed a T1 mapping phantom to CE/FDA manufacturing standards. An initial 69 phantoms with a multi-vendor user manual are now being scanned fortnightly in centers worldwide. Future results will explore T1 mapping sequences, platform performance, stability and the potential for standardization.

Keywords: Phantom; Standardization; T1 mapping.


Figures

Fig. 1
Fig. 1
Internal and external phantom structure. Internal (3 T, looking at the front—a) and external (1.5 T, front and back—b) T1MES phantom structure. The nine tubes are supported on a translucent resin base composed of unsaturated polyester/styrene. A careful hardening and curing process ensured a smooth surface finish for the resin base. The front of the phantom (b left) contains an isocenter cross label to aid positioning as well as an LCD thermometer. Careful positioning of the bottle on the scanner table (c) with the cap towards its head end is needed to ensure it is scanned at isocenter each time. HDPE = high-density polyethylene; LCD = liquid crystal display; NiCl2 = Nickel Chloride; PE = polyethylene; PVC = poly vinyl chloride
Fig. 2
Fig. 2
Artifact examples in earlier prototypes (a-g) and final T1MES phantom (i, j). Four earlier prototypes (models A—D) were rejected before the final model. a Coronal image of the earlier A-model (aqueous fill) showing bright artifacts around the tubes resulting from bSSFP going off-resonance that would have led to variations in T1 values by MOLLI and similar sequences. b Transverse image of A-model showing the characteristic ‘cat’s head’ artifact of air-bubbles trapped in the paramagnetically doped aqueous tubes. Significant off-resonance artifact is also noticeable in the central tubes. c Another coronal image through A-model but with larger gaps between tubes showing the combined effect of motion artifact (due to the aqueous fill) and B 0 distortion. d Transverse image of C-model attempting to use narrower tubes to pack 12 instead of 9, but significant Gibbs artifact can be seen in each tube. e Transverse image of C-model showing three small dark circular artifacts (12, 3 and 9 o’clock positions) caused by glue used to stabilize the tube arrangement. We subsequently switched to silicone-based glues that were less likely to trap air bubbles and were artifact-free. f Severe stabilisation artifact appearing as a thick dark band around the border of a D-model—here the phantom was scanned immediately after being received from the courier company and the bottle was still very cold from the transportation. Additionally susceptibility artifacts can be seen as thin linear bands spoiling some of the tubes (9 and 3 o’clock). g Significant image intensity inhomogeneity during a D-model test session on a GE scanner caused by accidental omission of the folded blanket, intended to separate the phantom bottle from the anterior chest coil. h Curved tube artifact and dark rings arising from ink printed onto the sides of digestive tubes (images courtesy of K. E. Keenan and NIST). i Coronal bSSFP localiser image and (j) typical T1 map of a final 3 T T1MES phantom obtained by MOLLI using a bSSFP readout on a Siemens 3 T Skyra scanner. bSSFP = balanced steady-state free precession; MOLLI = modified Look-Locker inversion recovery. Other abbreviation as in Fig. 1
Fig. 3
Fig. 3
Prototype models and T1MES project timeline. CE = Conformité Européene; FDA = Food and Drug Administration; GE = General Electric; NIST = US National Institute of Standards and Technology; PTB = German Physikalisch-Technische Bundesanstalt; QA = quality assurance; RH = Resonance Health
Fig. 4
Fig. 4
T1 and T2 values in T1MES. T1 and T2 values in the phantom mimic those of myocardium and blood pre and post-GBCA at 1.5 T (Panel a) and 3 T (Panel b). The 13 relaxometry scopes (refer to Table 2) are explained in the figure. Slow scan reference data for T1|T2 is displayed in green (for T1 by slow IRSE and for T2 by slow SE, RR interval 900 ms at 21 ± 2 °C), T1 values shown in orange represent the mean value per tube derived from tests on five of the E-model phantoms (using a 5(3)3 256-matrix RR = 900 ms at 21 ± 2 °C variant of MOLLI adapted for native T1 mapping; Siemens WIP 448B at 1.5 T and WIP 780B at 3 T), and in blue are T1|T2 values obtained by the manufacturer in Australia using a 1.4 T Bruker minispec relaxometer at 22 °C. Tube arrangement is such that long T1 tubes potentially suffering from more artifacts are kept towards the middle of the phantom and away from the corners. GBCA = gadolinium-based contrast agents; IRSE = inversion recovery spin echo; myo = myocardium; RR = inter-beat interval; SE = spin echo. All T1|T2 values are stated in ms. Other abbreviation as in Fig. 2
Fig. 5
Fig. 5
T1 and T2 relaxation times versus ingredients at 1.4 T: agarose and NiCl2. Grid represents results of the model. Red points represent single measurements. a Longitudinal relaxation time constant (T1), RMSE in R1 compared to the linear model was 4.8 × 10−5 /ms. b Spin–spin relaxation time (T2), RMSE in R2 compared to the linear model = 5.3 × 10−4 /ms. Since the x and y axes of both fits are comparable, the ingredient that contributes most can be identified. RMSE = root mean square error
Fig. 6
Fig. 6
Reference T1|T2 values. Variation in the mean T1 (red dots) and T2 (blue dots) reference values and standard deviation (whiskers) of the nine tubes averaged for the ten final batch T1MES phantoms that underwent ‘gold standard’ slow T1 and T2 measurements by IRSE and SE respectively at 1.5 T (a) and 3 T (b). T1 values obtained by MOLLI (5(3)3 [256] (WIP# 448B at 1.5 T and WIP# 780B at 3 T) pre-GBCA sequence (green dots) are also shown. Abbreviations as in Figs. 2 and 4
Fig. 7
Fig. 7
B 0 and B 1 field homogeneity. a B 0 field homogeneity across the nine phantom compartments as a measure of off-resonance in Hz at 3 T (single E-model phantom results). These are extremely small shifts in frequency (30 Hz = 0.25 ppm) at 3 T and should not be regarded as significantly different between the tubes. b Diagonal profile of the B 1 field (as per green discontinuous line in the inset) comparing relative flip angles on a Siemens 3 T system. Variance of B 1 was smallest across the 9 compartments with CoV 1.54 % for HDPE beads consisting of smooth, semi-translucent, colourless compact discs (as colouring in plastics has the potential to distort the B 0 magnetic field [12], see Fig. 2h) with a melt index >60 °C. We choose pellets that had not been regrinded, reblended or composite for this purpose. Highly monosized microbeads measured 6 μm and were composed of crosslinked PMMA polymer. Neither microbeads, sucrose nor NaCl were comparably effective in flattening the B 1 field. PMMA = poly methyl methacrylate. Other abbreviation as in Fig. 4
Fig. 8
Fig. 8
Temperature experiments in T1MES. Temperature dependency experiments (Test 1 in methods) performed on a D-model whole phantom (tube nomenclature differed from that used in E-models) comparing the stability of T1 (a) and T2 (b) values between two repeat experiments (2 days apart) at various temperatures between 15 °C and 32 °C on a 3 T Siemens Verio system. Whiskers represent mean ± standard error. (c) Temperature dependency experiment (Test 2 in methods) comparing T1|T2 values in tubes A, B, C, D, E and I (middle right insert) from a final E-model phantom across five temperatures
Fig. 9
Fig. 9
Short-term reproducibility. Short-term reproducibility (three runs) at the NIST laboratory (Test 1 in methods) for phantom T1values in six loose tubes (top left insert) from a final E-model phantom showing CoV of 1 % or less. Tube B with the longest T1|T2 showed the greatest variability between reads. CoV = coefficient of variation

References

    1. Moon JC, Messroghli DR, Kellman P, Piechnik SK, Robson MD, Ugander M, Gatehouse PD, Arai AE, Friedrich MG, Neubauer S, Schulz-Menger J, Schelbert EB. Myocardial T1 mapping and extracellular volume quantification: a Society for Cardiovascular Magnetic Resonance (SCMR) and CMR Working Group of the European Society of Cardiology consensus statement. J Cardiovasc Magn Reson. 2013;15:92. doi: 10.1186/1532-429X-15-92. - DOI - PMC - PubMed
    1. Kellman P, Arai AE, Xue H. T1 and extracellular volume mapping in the heart: estimation of error maps and the influence of noise on precision. J Cardiovasc Magn Reson. 2013;15:56. doi: 10.1186/1532-429X-15-56. - DOI - PMC - PubMed
    1. Kellman P, Hansen MS. T1-mapping in the heart: accuracy and precision. J Cardiovasc Magn Reson. 2014;16:2. doi: 10.1186/1532-429X-16-2. - DOI - PMC - PubMed
    1. Raman FS, Kawel-Boehm N, Gai N, Freed M, Han J, Liu C-Y, Lima JA, Bluemke DA, Liu S. Modified look-locker inversion recovery T1 mapping indices: assessment of accuracy and reproducibility between magnetic resonance scanners. J Cardiovasc Magn Reson. 2013;15:64. doi: 10.1186/1532-429X-15-64. - DOI - PMC - PubMed
    1. Messroghli DR, Greiser A, Fröhlich M, Dietz R, Schulz-Menger J. Optimization and validation of a fully-integrated pulse sequence for modified look-locker inversion-recovery (MOLLI) T1 mapping of the heart. J Magn Reson Imaging. 2007;26:1081–6. doi: 10.1002/jmri.21119. - DOI - PubMed