

Comparison of fluorescence probes for intracellular sodium imaging in prostate cancer cell lines
- PMID: 27660079
- PMCID: PMC5045488
- DOI: 10.1007/s00249-016-1173-7
Comparison of fluorescence probes for intracellular sodium imaging in prostate cancer cell lines
Abstract
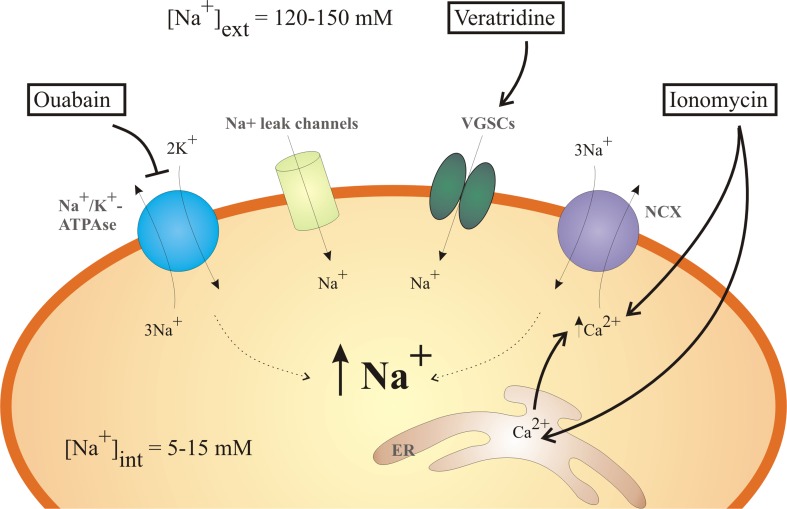
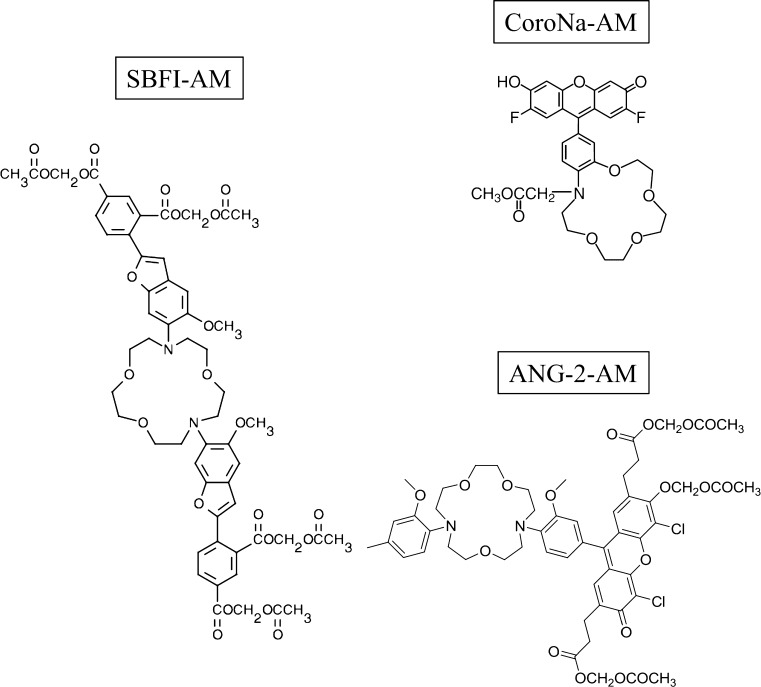
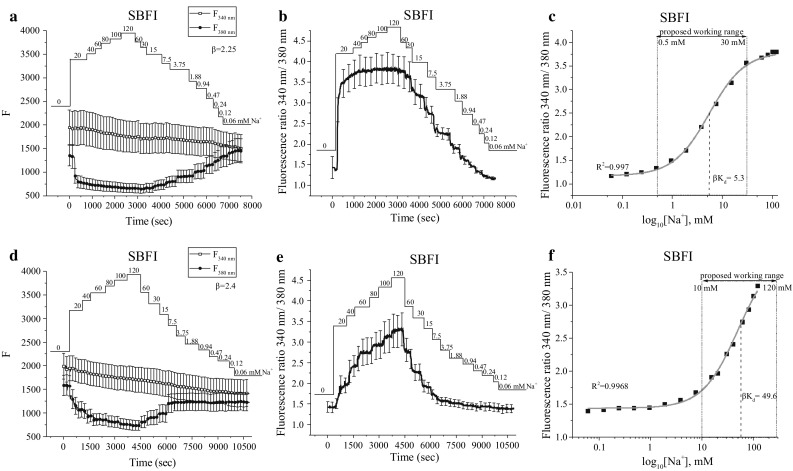
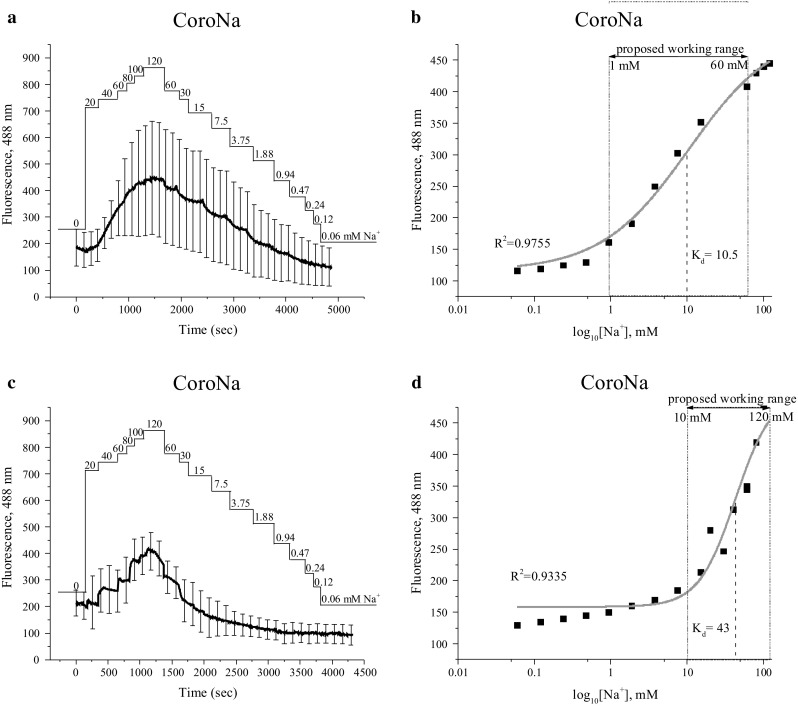
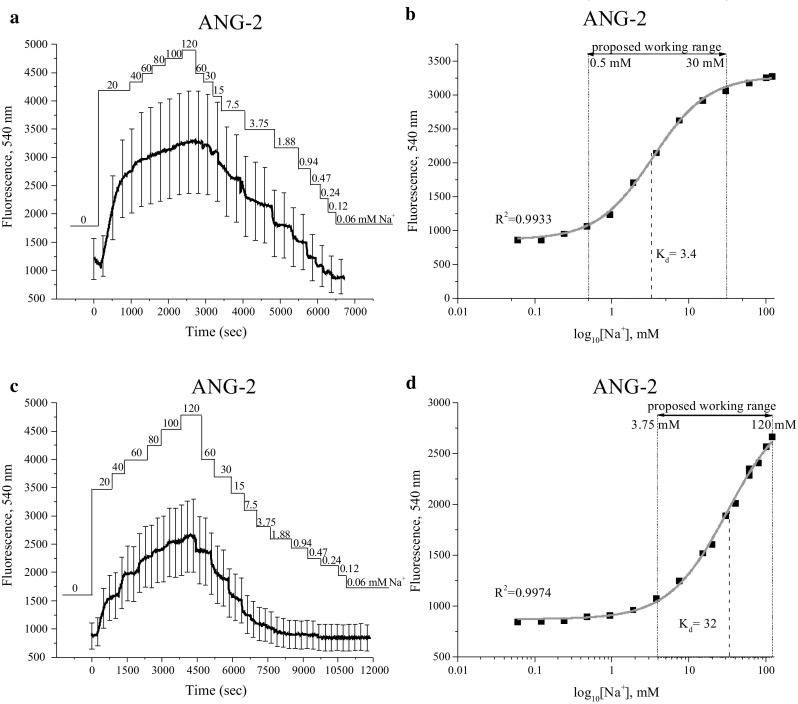
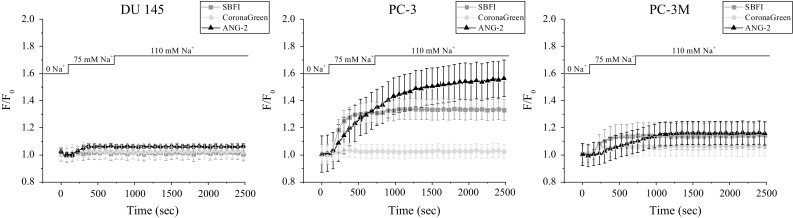
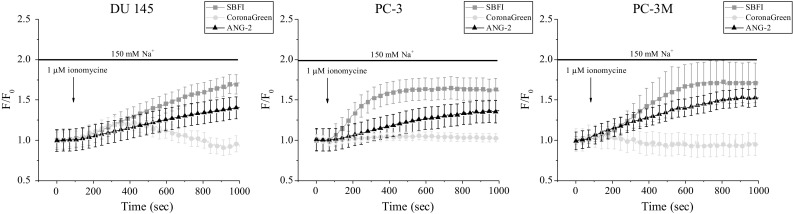
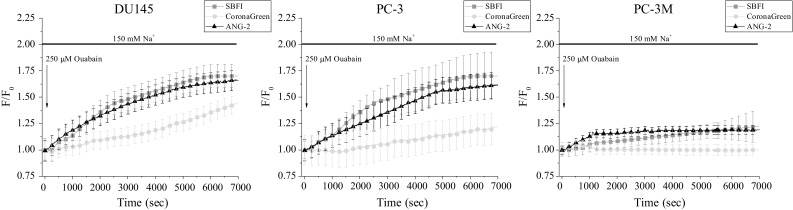
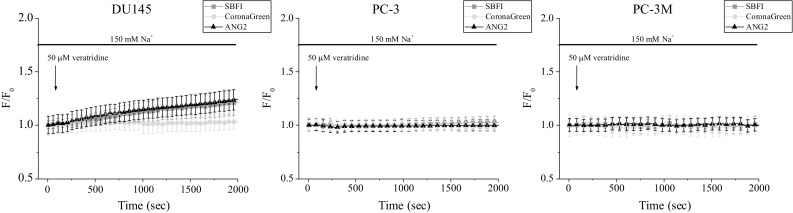
Sodium (Na+) ions are known to regulate many signaling pathways involved in both physiological and pathological conditions. In particular, alterations in intracellular concentrations of Na+ and corresponding changes in membrane potential are known to be major actors of cancer progression to metastatic phenotype. Though the functionality of Na+ channels and the corresponding Na+ currents can be investigated using the patch-clamp technique, the latter is rather invasive and a technically difficult method to study intracellular Na+ transients compared to Na+ fluorescence imaging. Despite the fact that Na+ signaling is considered an important controller of cancer progression, only few data using Na+ imaging approaches are available so far, suggesting the persisting challenge within the scientific community. In this study, we describe in detail the approach for application of Na+ imaging technique to measure intracellular Na+ variations in human prostate cancer cells. Accordingly, we used three Na+-specific fluorescent dyes-Na+-binding benzofuran isophthalate (SBFI), CoroNa™ Green (Corona) and Asante NaTRIUM Green-2 (ANG-2). These dyes have been assessed for optimal loading conditions, dissociation constant and working range after different calibration methods, and intracellular Na+ sensitivity, in order to determine which probe can be considered as the most reliable to visualize Na+ fluctuations in vitro.
Keywords: ANG-2; CoroNa Green; Fluorescent dye; Prostate cancer cells; SBFI; Sodium imaging.
Figures
Similar articles
-
Photophysical properties of Na+ -indicator dyes suitable for quantitative two-photon fluorescence-lifetime measurements.J Microsc. 2018 Nov;272(2):136-144. doi: 10.1111/jmi.12754. Epub 2018 Sep 7. J Microsc. 2018. PMID: 30191999
-
Properties of the new fluorescent Na+ indicator CoroNa Green: comparison with SBFI and confocal Na+ imaging.J Neurosci Methods. 2006 Sep 15;155(2):251-9. doi: 10.1016/j.jneumeth.2006.01.009. Epub 2006 Feb 20. J Neurosci Methods. 2006. PMID: 16488020
-
Fluorometric Na+ Evaluation in Single Cells Using Flow Cytometry: Comparison with Flame Emission Assay.Cell Physiol Biochem. 2020 May 29;54(4):556-566. doi: 10.33594/000000239. Cell Physiol Biochem. 2020. PMID: 32462850
-
Cardiac sodium transport and excitation-contraction coupling.J Mol Cell Cardiol. 2013 Aug;61:11-9. doi: 10.1016/j.yjmcc.2013.06.003. Epub 2013 Jun 14. J Mol Cell Cardiol. 2013. PMID: 23774049 Review.
-
Targeting the pH Paradigm at the Bedside: A Practical Approach.Int J Mol Sci. 2020 Dec 3;21(23):9221. doi: 10.3390/ijms21239221. Int J Mol Sci. 2020. PMID: 33287221 Free PMC article. Review.
Cited by
-
Live visualisation of electrolytes during mouse embryonic development using electrolyte indicators.PLoS One. 2021 Jan 29;16(1):e0246337. doi: 10.1371/journal.pone.0246337. eCollection 2021. PLoS One. 2021. PMID: 33513193 Free PMC article.
-
Screening an In-House Isoquinoline Alkaloids Library for New Blockers of Voltage-Gated Na+ Channels Using Voltage Sensor Fluorescent Probes: Hits and Biases.Molecules. 2022 Jun 28;27(13):4133. doi: 10.3390/molecules27134133. Molecules. 2022. PMID: 35807390 Free PMC article.
-
Molecular and physical technologies for monitoring fluid and electrolyte imbalance: A focus on cancer population.Clin Transl Med. 2021 Jun;11(6):e461. doi: 10.1002/ctm2.461. Clin Transl Med. 2021. PMID: 34185420 Free PMC article. Review.
-
Role of Piezo1 in Terminal Density Reversal of Red Blood Cells.Cells. 2024 Aug 16;13(16):1363. doi: 10.3390/cells13161363. Cells. 2024. PMID: 39195253 Free PMC article.
-
ROCK Inhibitor Enhances Resilience Against Metabolic Stress Through Increasing Bioenergetic Capacity in Corneal Endothelial Cells.Invest Ophthalmol Vis Sci. 2025 Jan 2;66(1):51. doi: 10.1167/iovs.66.1.51. Invest Ophthalmol Vis Sci. 2025. PMID: 39847368 Free PMC article.
References
-
- Armstrong CM. Sodium channels and gating currents. Physiol Rev. 1981;61:644–683. - PubMed
Publication types
MeSH terms
Substances
LinkOut - more resources
Full Text Sources
Other Literature Sources
Medical
Miscellaneous
