. 2017 Feb;16(1):173-182.
doi: 10.1111/acel.12540. Epub 2016 Sep 22.

Activated monocytes resist elimination by retinal pigment epithelium and downregulate their OTX2 expression via TNF-α

Affiliations

Activated monocytes resist elimination by retinal pigment epithelium and downregulate their OTX2 expression via TNF-α

Thibaud Mathis et al. Aging Cell. 2017 Feb.

Abstract

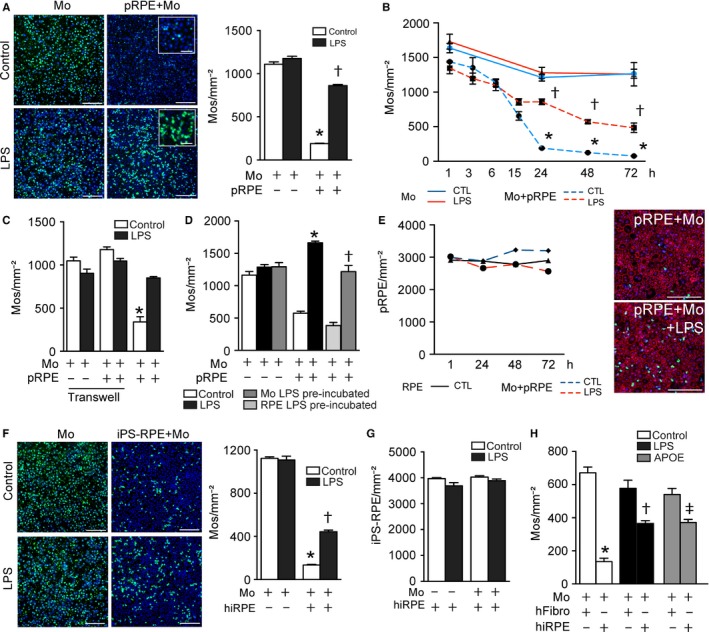
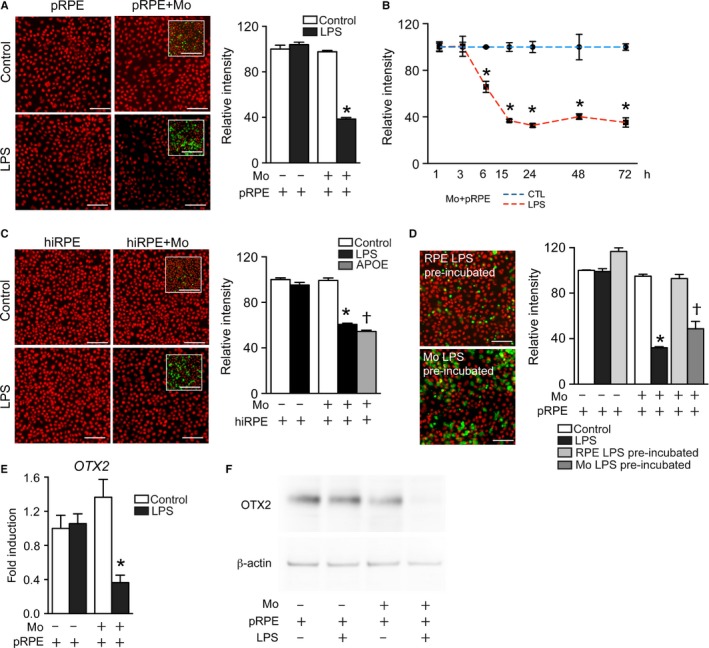
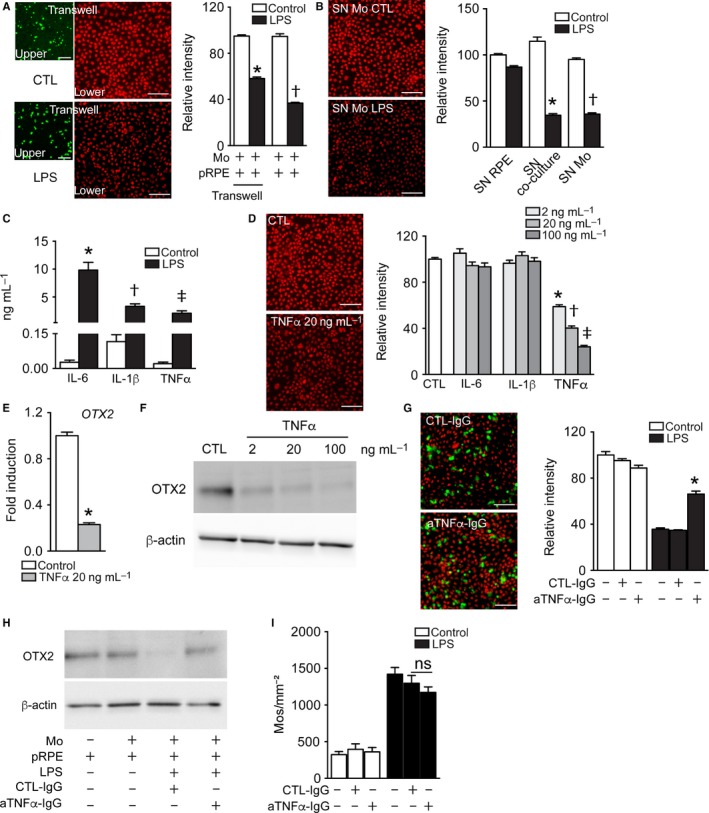
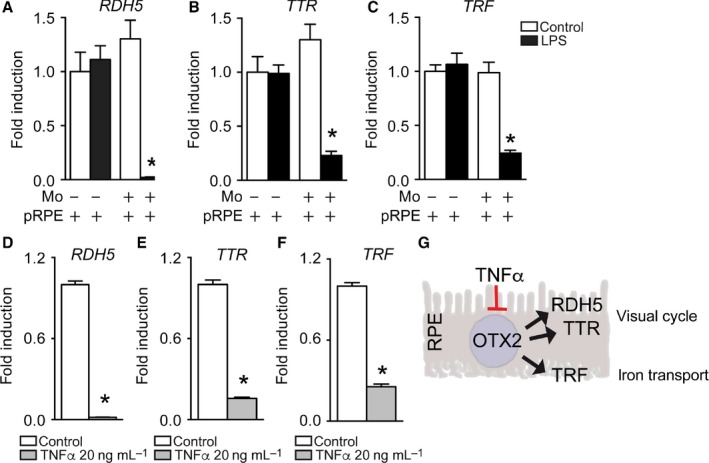
Orthodenticle homeobox 2 (OTX2) controls essential, homeostatic retinal pigment epithelial (RPE) genes in the adult. Using cocultures of human CD14+ blood monocytes (Mos) and primary porcine RPE cells and a fully humanized system using human-induced pluripotent stem cell-derived RPE cells, we show that activated Mos markedly inhibit RPEOTX2 expression and resist elimination in contact with the immunosuppressive RPE. Mechanistically, we demonstrate that TNF-α, secreted from activated Mos, mediates the downregulation of OTX2 and essential RPE genes of the visual cycle among others. Our data show how subretinal, chronic inflammation and in particular TNF-α can affect RPE function, which might contribute to the visual dysfunctions in diseases such as age-related macular degeneration (AMD) where subretinal macrophages are observed. Our findings provide important mechanistic insights into the regulation of OTX2 under inflammatory conditions. Therapeutic restoration of OTX2 expression might help revive RPE and visual function in retinal diseases such as AMD.

Keywords: OTX2; TNF-α; age-related macular degeneration; monocytes; retinal pigment epithelium; visual cycle.


Figures

Figure 1
Figure 1
The RPE efficiently eliminates naïve‐ but not activated monocytes in vitro. (A) Representative pictures and quantification of CFSE labeled Mos at 24 h in monoculture (left panels) and pRPE/Mo coculture (right panels), incubated without (upper panels) or with LPS (lower panels). Blue fluorescence: DAPI; green fluorescence: CFSE (inset, close‐up view). Corresponding Arrayscan quantification of CFSE + DAPI +Mos (n = 6/group; one‐way ANOVA/Bonferroni test: pRPE+Mos versus Mos *P ˂ 0.0001; pRPE+Mos+LPS versus pRPE+Mos †P ˂ 0.0001). (B) Quantification of the density of CFSE + DAPI +Mos in monoculture (uninterrupted lines) or pRPE/Mo coculture (dotted lines) at indicated times with (red lines) or without (blue lines) LPS (n = 3/group; one‐way ANOVA/Bonferroni test: pRPE+Mos versus Mos *P < 0.0001 for each time point; pRPE+Mos+LPS versus pRPE+Mos at 24 h†P < 0.0001, at 48 h †P < 0.0001, at 72 h †P = 0.0064). (C) Quantification at 24 h of the density of CFSE + DAPI +Mos in monoculture, and transwell or contact coculture with pRPE with and without LPS (n = 4/group; one‐way ANOVA/Bonferroni test: pRPE+Mos versus any other group *P ˂ 0.0001). (D) Quantification of the density of CFSE + DAPI +Mos in monoculture or coculture after LPS‐pre‐activation of Mos or pre‐activation of the pRPE cells and 24 h culture in LPS‐free DMEM compared with LPS‐activated coculture (n = 3–4/group; one‐way ANOVA/Bonferroni test: pRPE+Mos+LPS versus pRPE+Mos *P ˂ 0.0001; pRPE+Mos/LPSPA versus pRPE+Mos†P = 0.0003). (E) Quantification of the density of OTX2+ DAPI + pRPE in monoculture (black uninterrupted line) or coculture (dotted lines) at 1 h, 24 h, 48 h, and 72 h with (red line) or without (blue line) 1 ng mL−1 of LPS (n = 4/group). Representative images of ZO‐1 (red), CFSE (green), DAPI (blue) staining of 24 h pRPE/Mo cocultures without (upper panel) and with LPS (lower panel). (F) Representative pictures and quantification of the density of CFSE + DAPI +Mos at 24 h in monoculture (left panels) and hiRPE/Mo coculture (right panels), incubated without (upper panels) or with (lower panels) LPS. Blue fluorescence: DAPI; green fluorescence: CFSE (n = 6/per group; one‐way ANOVA/Bonferroni test: hiRPE+Mos versus Mos *P ˂ 0.0001; hiRPE+Mos+LPS versus hiRPE+Mos †˂ 0.0001). (G) Quantification of the density of OTX2+ DAPI +hiRPE at 24 h in monoculture or coculture with or without LPS (n = 6/group one‐way ANOVA/Bonferroni test: no significant). (H) Quantification of the density of CFSE + DAPI +Mos after 24 h of coculture of Mo with either human foreskin fibroblasts, or hiRPE derived from these fibroblasts activated with LPS or APOE (n = 5/group; one‐way ANOVA/Bonferroni test: hiRPE+Mos versus hFibro+Mos *P ˂ 0.0001; hiRPE+Mos versus hiRPE+Mos+LPS; †P < 0.0001; hiRPE+Mos versus hiRPE+Mos+APOEP < 0.0001).Data information: All experiments were repeated three times with similar results. Mos: monocytes; pRPE: porcine primary retinal pigment epithelial cells; hiRPE: human‐induced pluripotent stem cell‐derived RPE cells; hFibro: human foreskin fibroblasts; CTL: control; LPS: lipopolysaccharide; APOE: apolipoprotein E isoform 3. Scale bar A, E and F: 100 μm, insets 20 μm.
Figure 2
Figure 2
Activated Monocytes downregulate RPE OTX2 expression. (A) Representative pictures of OTX2 immunohistochemistry of pRPE at 24 h in pRPE cultures (left panels) and pRPE/Mo cocultures (right panels), incubated without (upper panels) or with (lower panels) LPS. Red fluorescence: OTX2; green fluorescence: CFSE (inset, close‐up view). Corresponding relative fluorescence intensity quantification of OTX2 fluorescence intensity (n = 6/group; one‐way ANOVA/Bonferroni test: pRPE+Mos+LPS versus any other group *P ˂ 0.0001). (B) Relative fluorescence intensity quantification at indicated times of OTX2 fluorescence intensity in cocultures with (red line) or without (blue line) LPS (n = 3/group; one‐way ANOVA/Bonferroni test: pRPE+Mos versus pRPE+Mos+LPS *P < 0.0001 for each time point). (C) Representative pictures of OTX2 immunohistochemistry of hiRPE at 24 h in monoculture (left panels) and hiRPE/Mo cocultures (right panels), incubated without (upper panels) or with (lower panels) of LPS. Red fluorescence: OTX2; green fluorescence: CFSE (inset, close‐up view). Corresponding relative fluorescence intensity quantification of OTX2 fluorescence intensity (n = 6/group, one‐way ANOVA/Bonferroni test: hiRPE+Mos+LPS versus any other group *P ˂ 0.0001). (D) Representative pictures of OTX2 immunohistochemistry (red) of cocultures of LPS‐pre‐activated pRPE (upper panel), or LPS‐pre‐activated Mos (lower panel) before 24 h of LPS‐free coculture in DMEM (green fluorescence: CFSE). Relative fluorescence intensity quantification at 24 h of OTX2 fluorescence intensity in control, LPS‐activated, and LPS‐pre‐activated pRPE and Mo cocultures (n = 3‐4/group, one‐way ANOVA/Bonferroni test: pRPE+Mos+LPS versus pRPE+Mos *P ˂ 0.0001; pRPE+LPS‐pre‐activated Mos versus pRPE+Mos †P ˂ 0.0001). (E) Relative expression of OTX2‐mRNA normalized with S26 expression quantified by RTqPCR of 24 h pRPE culture or pRPE+Mo coculture, with or without LPS (n = 8/group one‐way ANOVA/Bonferroni test: pRPE+Mos+LPS versus any other group *P ˂ 0.05). (F) Western blot analysis of OTX2‐ and β‐actin protein after 24 h of the indicated culture conditions. Data information: All experiments were repeated three times with similar results. Mos: monocytes; pRPE: porcine primary retinal pigment epithelial cells; hiRPE: human‐induced pluripotent stem cell‐derived RPE cells; CTL: control; LPS: lipopolysaccharide. Scale bar A, C, and D: 50 μm, insets 100 μm.
Figure 3
Figure 3
TNFα mediates activated Mo‐induced RPE OTX2 downregulation. (A) Representative images of the upper (green CFSE‐stained Mos) and lower chambers (OTX2 immunohistochemistry of pRPE, red) of 24‐h transwell cocultures and relative red fluorescence intensity quantification at 24 h (n = 4/group, one‐way ANOVA/Bonferroni test: TW pRPE+Mos+LPS versus any other TW group *P ˂ 0.0001; pRPE+Mos+LPS versus any other contact coculture group †P ˂ 0.0001). (B) Representative images (OTX2 red) and relative fluorescence intensity quantification of OTX2‐fluorescence intensity in pRPE culture after 24 h of incubation with conditioned supernatant (SN) from 24 h culture of pRPE, Mo/pRPE, or Mos with and without LPS. (n = 6/group, one‐way ANOVA/Bonferroni test: SNpRPE+Mos+LPS versus SNpRPE+Mos *P ˂ 0.0001; SN‐Mos+LPS versus SN‐Mos †P ˂ 0.0001). (C) IL‐6, IL‐1β and TNF‐α ELISA of supernatants from 24 h Mo culture with or without of LPS (n = 8–12/group, Mann–Whitney U‐test: IL‐6 *P = 0.0002; IL‐1β †P = 0.002; TNF‐α ‡P < 0.0001). (D) Representative pictures and relative fluorescence intensity quantification at 24 h of OTX2‐fluorescence intensity in pRPE culture incubated with IL‐6, IL‐1β, and TNF‐α at different concentration (2 ng mL−1, 20 ng mL−1, and 100 ng mL−1) compared with the control condition with no treatment (n = 6–9/group one‐way ANOVA/Bonferroni test: pRPE control versus any TNF‐α group *, †, ‡ P ˂ 0.0001). Red fluorescence: OTX2. (E) Relative expression of OTX2‐mRNA normalized with S26 expression quantified by RTqPCR of 24 h pRPE culture treated or not with 20 ng mL−1 of TNF‐α (n = 12/group Mann–Whitney U‐test: pRPE+ TNF‐α versus pRPE *P < 0.0001). (F) Western blot analysis of OTX2‐ and β‐actin protein after 24 h of pRPE culture treated with TNF‐α at 2, 20, and 100 ng mL−1. (G) Representative images and relative fluorescence intensity quantification at 24 h of OTX2‐immunohistochemistry (red) in pRPE/CFSE +Mo (green) coculture incubated with and without LPS and anti‐TNF‐α‐ or control‐IgG (n = 4–6/group, one‐way ANOVA/Bonferroni test: pRPE+Mos+LPS+TNF‐α versus pRPE+Mos+LPS+IgG *P ˂ 0.0001). (H) Western blot analysis of OTX2‐ and β‐actin protein after 24 h of pRPE/Mo coculture incubated with anti‐TNF‐α‐ or control‐IgG. (I) Quantification of the density of CFSE + DAPI +Mos at 24 h of pRPE/CFSE +Mo coculture incubated with and without LPS and with anti‐TNF‐α‐ or control‐IgG (n = 4–6/group). Data information: All experiments were repeated twice with similar results. Mos: Monocytes; pRPE: porcine primary retinal pigment epithelial cells; CTL: control; LPS: lipopolysaccharide. Scale bars = 50 μm.
Figure 4
Figure 4
Activated Monocytes lead to essential OTX2‐dependent RPE gene downregulation. (A–C) Relative expression of (A) RDH5‐mRNA, (B) TTRmRNA, and (C) TRFmRNA normalized with S26 gene expression quantified by RTqPCR in 24‐h pRPE monoculture or pRPE+Mo coculture, with or without LPS (n = 6/group one‐way ANOVA/Bonferroni test: pRPE+Mos+LPS versus any other group *P ˂ 0.0001). (D–F) Relative expression of (D) RDH5‐mRNA, (E) TTRmRNA, and (F) TRFmRNA normalized with S26 gene expression quantified by RTqPCR in 24 h pRPE culture with or without 20 ng mL−1 of TNF‐α (n = 6/group Mann–Whitney U‐test: pRPE+TNF‐α versus pRPE *P = 0.0022). (G) Graphical summary. Data information: All experiments were repeated twice with similar results. Mos: Monocytes; pRPE: porcine primary retinal pigment epithelial cells; CTL: control; LPS: lipopolysaccharide.

Similar articles

Cited by

References

    1. Acampora D, Mazan S, Lallemand Y, Avantaggiato V, Maury M, Simeone A, Brûlet P (1995) Forebrain and midbrain regions are deleted in Otx2‐/‐ mutants due to a defective anterior neuroectoderm specification during gastrulation. Dev. Camb. Engl. 121, 3279–3290. - PubMed
    1. Arnault E, Barrau C, Nanteau C, Gondouin P, Bigot K, Viénot F, Gutman E, Fontaine V, Villette T, Cohen‐Tannoudji D, Sahel J‐A, Picaud S (2013) Phototoxic action spectrum on a retinal pigment epithelium model of age‐related macular degeneration exposed to sunlight normalized conditions. PLoS ONE 8, e71398. - PMC - PubMed
    1. Béby F, Housset M, Fossat N, Le Greneur C, Flamant F, Godement P, Lamonerie T (2010) Otx2 gene deletion in adult mouse retina induces rapid RPE dystrophy and slow photoreceptor degeneration. PLoS ONE 5, e11673. - PMC - PubMed
    1. Becroft DM (1981) Prenatal cytomegalovirus infection: epidemiology, pathology and pathogenesis. Perspect. Pediatr. Pathol. 6, 203–241. - PubMed
    1. Cantos R, Cole LK, Acampora D, Simeone A, Wu DK (2000) Patterning of the mammalian cochlea. Proc. Natl. Acad. Sci. U. S. A. 97, 11707–11713. - PMC - PubMed