. 2017 Mar;58(3):484-491.
doi: 10.2967/jnumed.115.170910. Epub 2016 Sep 22.

Pharmacokinetic Evaluation of the Tau PET Radiotracer 18F-T807 (18F-AV-1451) in Human Subjects

Affiliations

Pharmacokinetic Evaluation of the Tau PET Radiotracer 18F-T807 (18F-AV-1451) in Human Subjects

Dustin W Wooten et al. J Nucl Med. 2017 Mar.

Abstract

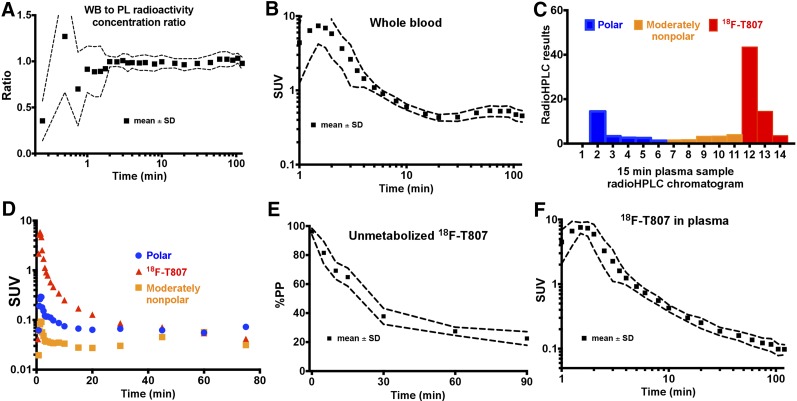
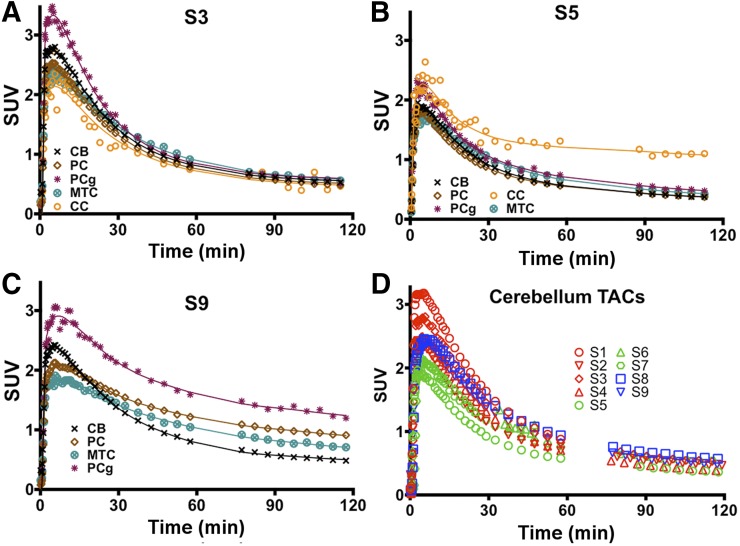
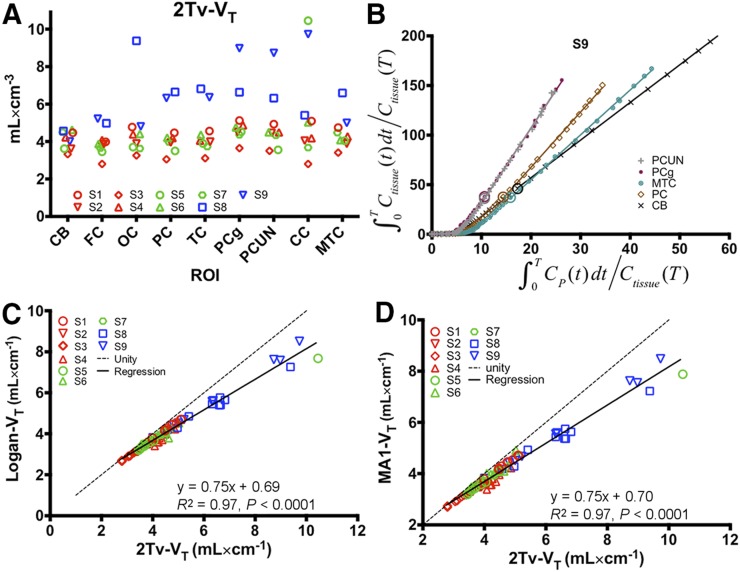
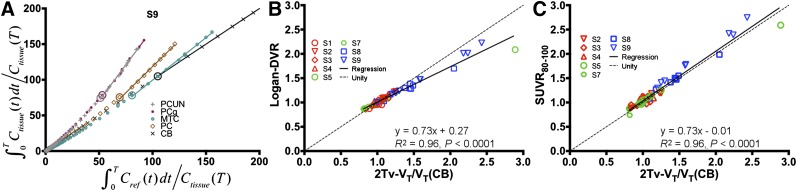
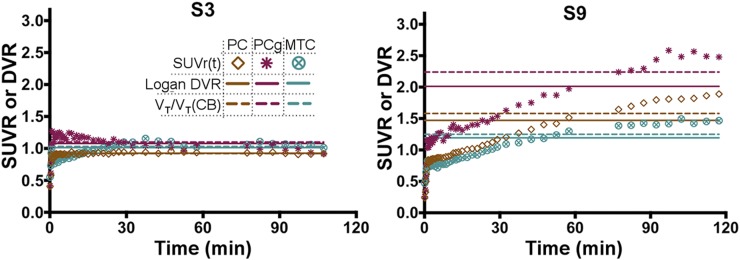
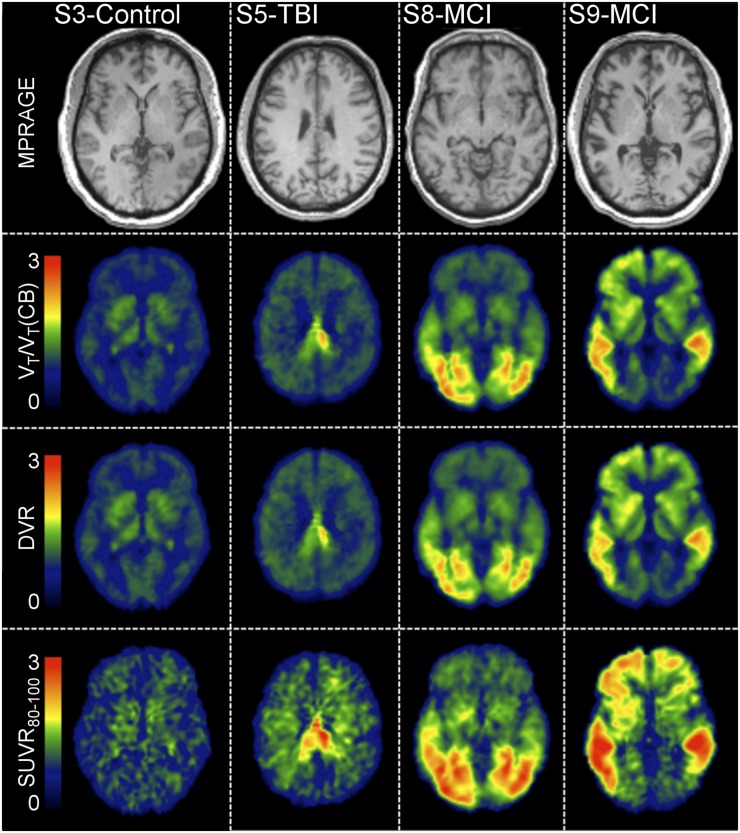
18F-T807 is a PET radiotracer developed for imaging tau protein aggregates, which are implicated in neurologic disorders including Alzheimer disease and traumatic brain injury (TBI). The current study characterizes 18F-T807 pharmacokinetics in human subjects using dynamic PET imaging and metabolite-corrected arterial input functions. Methods: Nine subjects (4 controls, 3 with a history of TBI, 2 with mild cognitive impairment due to suspected Alzheimer disease) underwent dynamic PET imaging for up to 120 min after bolus injection of 18F-T807 with arterial blood sampling. Total volume of distribution (VT) was estimated using compartmental modeling (1- and 2-tissue configurations) and graphical analysis techniques (Logan and multilinear analysis 1 [MA1] regression methods). Reference region-based methods of quantification were explored including Logan distribution volume ratio (DVR) and static SUV ratio (SUVR) using the cerebellum as a reference tissue. Results: The percentage of unmetabolized 18F-T807 in plasma followed a single exponential with a half-life of 17.0 ± 4.2 min. Metabolite-corrected plasma radioactivity concentration fit a biexponential (half-lives, 18.1 ± 5.8 and 2.4 ± 0.5 min). 18F-T807 in gray matter peaked quickly (SUV > 2 at ∼5 min). Compartmental modeling resulted in good fits, and the 2-tissue model with estimated blood volume correction (2Tv) performed best, particularly in regions with elevated binding. VT was greater in mild cognitive impairment subjects than controls in the occipital, parietal, and temporal cortices as well as the posterior cingulate gyrus, precuneus, and mesial temporal cortex. High focal uptake was found in the posterior corpus callosum of a TBI subject. Plots from Logan and MA1 graphical methods became linear by 30 min, yielding regional estimates of VT in excellent agreement with compartmental analysis and providing high-quality parametric maps when applied in voxelwise fashion. Reference region-based approaches including Logan DVR (t* = 55 min) and SUVR (80- to 100-min interval) were highly correlated with DVR estimated using 2Tv (R2 = 0.97, P < 0.0001). Conclusion:18F-T807 showed rapid clearance from plasma and properties suitable for tau quantification with PET. Furthermore, simplified approaches using DVR (t* = 55 min) and static SUVR (80-100 min) with cerebellar reference tissue were found to correlate highly with compartmental modeling outcomes.

Keywords: 18F-T807; PET; kinetic modeling; pharmacokinetics; tau.


Figures

FIGURE 1.
FIGURE 1.
Arterial blood measurements. (A) Plot of whole-blood–to–plasma radioactivity concentration ratio. (B) Whole-blood SUV time course. (C) Reversed-phase radio–high-performance liquid chromatogram from 15-min plasma sample in subject 6 with polar, moderately nonpolar, and 18F-T807 components delineated. (D) Time course of polar, slightly nonpolar, and 18F-T807 components as depicted in C. (E) %PP of 18F-T807. (F) 18F-T807 SUV time course in plasma. A, B, E, and F show mean and SD across all subjects, whereas C and D show data from representative subject. PL = plasma; WB = whole blood.
FIGURE 2.
FIGURE 2.
(A–C) Time–activity curves and 2Tv (solid lines) fits for a control subject (subject 3), a subject with history of TBI (subject 5), and an MCI subject (subject 9). (D) SUV PET measured time course in cerebellum for all subjects. TAC = time–activity curves.
FIGURE 3.
FIGURE 3.
Results from arterial input function–based analyses. (A) Regional VT estimates from 2Tv compartmental model in cerebellum (CB), frontal cortex (FC), occipital cortex (OC), parietal cortex (PC), temporal cortex (TC), posterior cingulate gyrus (PCg), precuneus (PCUN), subject-specific region of interest (ROI) in corpus callosum (CC), and mesial temporal cortex (MTC). (B) Demonstration of Logan plot linearization in MCI subject (subject 9) for estimation of VT. Large circles depict 30-min t* point. Axes were truncated to enhance visualization of higher binding regions. (C and D) Comparison of 2Tv and graphical estimates of VT using either Logan analysis (C) or MA1 (D). In A, C, and D, red markers designate control subjects, green markers correspond to TBI subjects, and blue markers indicate MCI subjects.
FIGURE 4.
FIGURE 4.
Results from reference region–based analyses with cerebellar input functions. (A) Demonstration of Logan plot linearization in MCI subject (subject 9) for estimation of DVR. Large circles depict 55-min t* point. Axes were scaled down to enhance visualization of higher uptake regions. Comparison of Logan DVR (B) and SUVR80–100 (C) against indirect calculations of DVR given VT/VTref with distribution volumes estimated by compartmental modeling with arterial input functions and VTref corresponding to cerebellum. CB = cerebellum; PC = parietal cortex; PCg = posterior cingulate gyrus; PCUN = precuneus; MTC = mesial temporal cortex.
FIGURE 5.
FIGURE 5.
SUVR time courses (symbols), DVR estimated directly by Logan regression with reference region inputs (horizontal solid lines), and DVR estimated indirectly by VT/VTref from compartmental modeling with arterial inputs (horizontal dashed lines) for control subject (subject 3) and MCI subject (subject 9). CB = cerebellum; PC = parietal cortex; PCg = posterior cingulate gyrus; MTC = mesial temporal cortex.
FIGURE 6.
FIGURE 6.
MPRAGE in template space and parametric images of indirect calculation of DVR using Logan (VT/VT(CB)), Logan DVR, and SUVR in control subject (subject 3), a subject with history of TBI (subject 5), and 2 subjects with MCI (subjects 8 and 9).

References

    1. Iqbal K, Liu F, Gong CX, Grundke-Iqbal I. Tau in Alzheimer disease and related tauopathies. Curr Alzheimer Res. 2010;7:656–664. - PMC - PubMed
    1. James OG, Doraiswamy PM, Borges-Neto S. PET imaging of tau pathology in Alzheimer’s disease and tauopathies. Front Neurol. 2015;6:38. - PMC - PubMed
    1. Hyman BT, Phelps CH, Beach TG, et al. National Institute on Aging-Alzheimer’s Association guidelines for the neuropathologic assessment of Alzheimer’s disease. Alzheimers Dement. 2012;8:1–13. - PMC - PubMed
    1. Goldstein LE, Fisher AM, Tagge CA, et al. Chronic traumatic encephalopathy in blast-exposed military veterans and a blast neurotrauma mouse model. Sci Transl Med. 2012;4:134ra60. - PMC - PubMed
    1. McKee AC, Cantu RC, Nowinski CJ, et al. Chronic traumatic encephalopathy in athletes: progressive tauopathy after repetitive head injury. J Neuropathol Exp Neurol. 2009;68:709–735. - PMC - PubMed

Publication types