

Differentiation of pancreatic carcinoma and mass-forming focal pancreatitis: qualitative and quantitative assessment by dynamic contrast-enhanced MRI combined with diffusion-weighted imaging
- PMID: 27661003
- PMCID: PMC5352094
- DOI: 10.18632/oncotarget.12120
Differentiation of pancreatic carcinoma and mass-forming focal pancreatitis: qualitative and quantitative assessment by dynamic contrast-enhanced MRI combined with diffusion-weighted imaging
Abstract
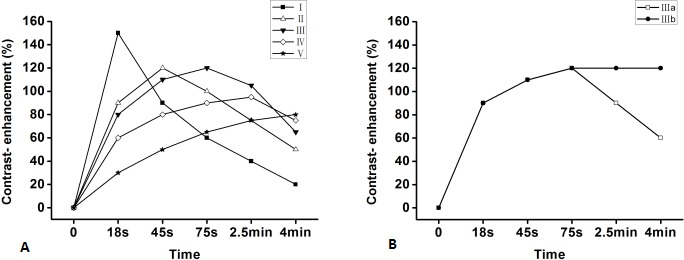
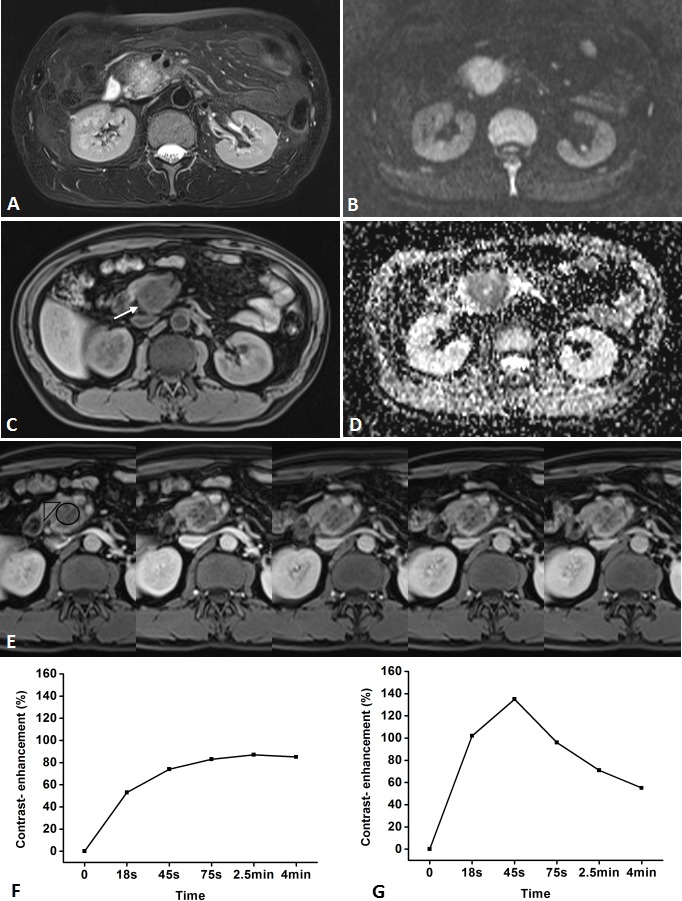
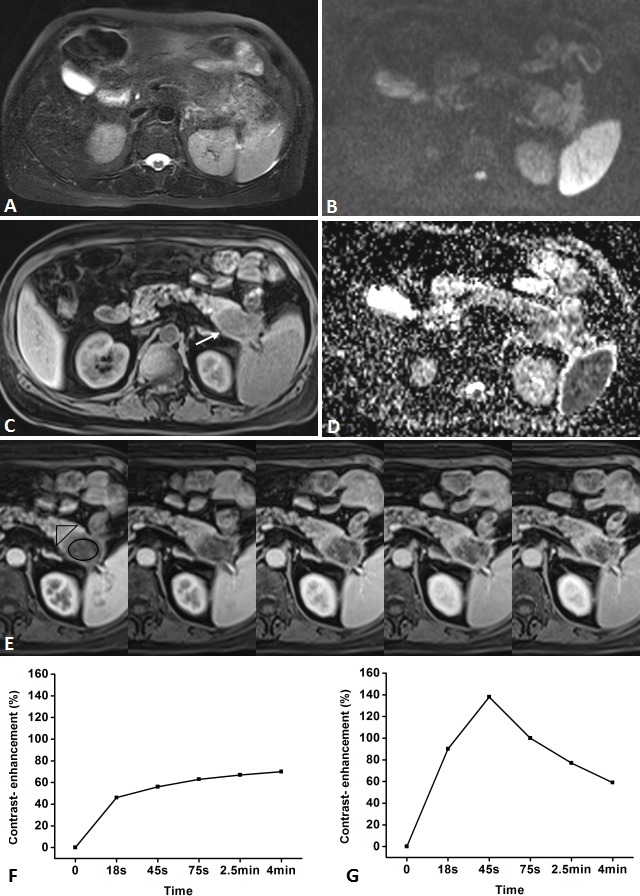
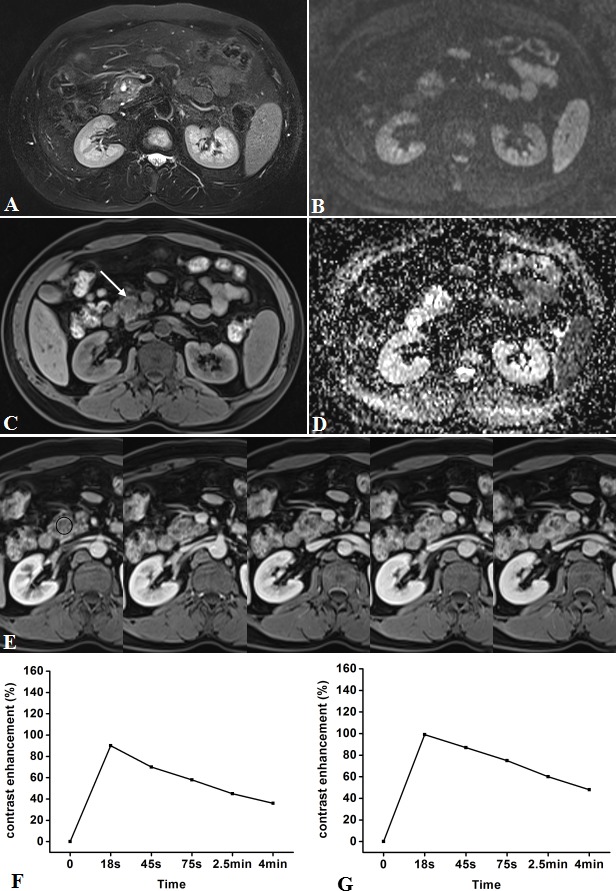
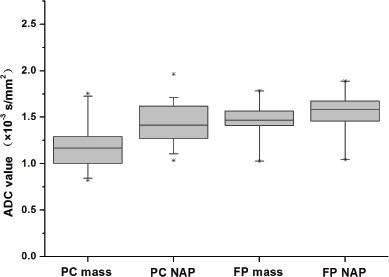
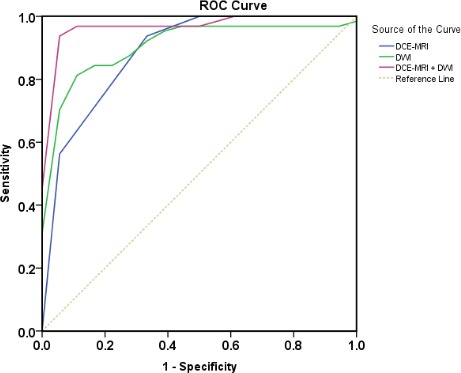
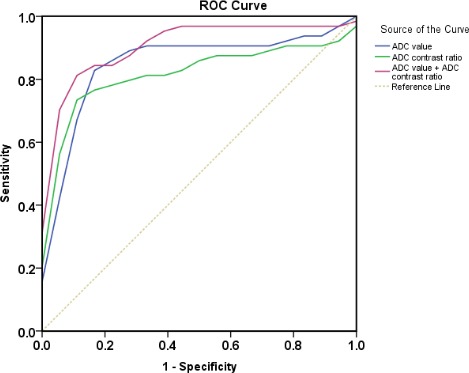
Differentiation between pancreatic carcinoma (PC) and mass-forming focal pancreatitis (FP) is invariably difficult. For the differential diagnosis, we qualitatively and quantitatively assessed the value of dynamic contrast-enhanced MRI (DCE-MRI) and diffusion-weighted imaging (DWI) in PC and FP in the present study. This study included 32 PC and 18 FP patients with histological confirmation who underwent DCE-MRI and DWI. The time-signal intensity curve (TIC) of PC and FP were classified into 5 types according to the time of reaching the peak, namely, type I, II, III, IV, and V, respectively, and two subtypes, namely, subtype-a (washout type) and subtype-b (plateau type) according to the part of the TIC profile after the peak. Moreover, the mean and relative apparent diffusion coefficient (ADC) value between PC and FP on DWI were compared. The type V TIC was only recognized in PC group (P < 0.01). Type IV b were more frequently observed in PC (P = 0.036), while type- IIa (P < 0.01), type- Ia (P = 0.037) in FP. We also found a significant difference in the mean and relative ADC value between PC and FP. The combined image set of DCE-MRI and DWI yielded an excellent sensitivity, specificity, and diagnostic accuracy (96.9%, 94.4%, and 96.0%). The TIC of DCE-MRI and ADC value of DWI for pancreatic mass were found to provide reliable information in differentiating PC from FP, and the combination of DCE-MRI and DWI can achieve a higher sensitivity, specificity, and diagnostic accuracy.
Keywords: diffusion-weighted imaging; dynamic contrast-enhanced MRI; mass-forming focal pancreatitis; pancreatic carcinoma.
Conflict of interest statement
The authors declare that there is no conflict of interest related to this work.
Figures

Similar articles
-
Apparent diffusion coefficient measurements of the pancreas, pancreas carcinoma, and mass-forming focal pancreatitis.Acta Radiol. 2012 Mar 1;53(2):135-9. doi: 10.1258/ar.2011.100252. Epub 2012 Jan 19. Acta Radiol. 2012. PMID: 22262868
-
Pancreatic diffusion-weighted imaging (DWI): comparison between mass-forming focal pancreatitis (FP), pancreatic cancer (PC), and normal pancreas.J Magn Reson Imaging. 2009 Feb;29(2):350-6. doi: 10.1002/jmri.21651. J Magn Reson Imaging. 2009. PMID: 19161187
-
Focal pancreatitis mimicking pancreatic mass: magnetic resonance imaging (MRI)/magnetic resonance cholangiopancreatography (MRCP) findings including diffusion-weighted MRI.Acta Radiol. 2008 Jun;49(5):490-7. doi: 10.1080/02841850802014602. Acta Radiol. 2008. PMID: 18568532
-
Quantified ADC histogram analysis: a new method for differentiating mass-forming focal pancreatitis from pancreatic cancer.Acta Radiol. 2014 Sep;55(7):785-92. doi: 10.1177/0284185113509264. Epub 2013 Oct 28. Acta Radiol. 2014. PMID: 24167322
-
[Diffusion-weighted imaging of the pancreas].Radiologe. 2011 Mar;51(3):186-94. doi: 10.1007/s00117-010-2059-9. Radiologe. 2011. PMID: 21305263 Review. German.
Cited by
-
Pancreatic cancer, autoimmune or chronic pancreatitis, beyond tissue diagnosis: Collateral imaging and clinical characteristics may differentiate them.World J Gastrointest Oncol. 2023 Jun 15;15(6):925-942. doi: 10.4251/wjgo.v15.i6.925. World J Gastrointest Oncol. 2023. PMID: 37389107 Free PMC article. Review.
-
[Chronic pancreatitis : Characterization and differentiation from pancreatic cancer].Radiologe. 2021 Jun;61(6):563-571. doi: 10.1007/s00117-021-00857-9. Epub 2021 May 17. Radiologe. 2021. PMID: 34002282 Free PMC article. Review. German.
-
Accuracy of quantitative diffusion-weighted imaging for differentiating benign and malignant pancreatic lesions: a systematic review and meta-analysis.Eur Radiol. 2021 Oct;31(10):7746-7759. doi: 10.1007/s00330-021-07880-3. Epub 2021 Apr 13. Eur Radiol. 2021. PMID: 33847811
-
Combination of DCE-MRI and DWI in Predicting the Treatment Effect of Concurrent Chemoradiotherapy in Esophageal Carcinoma.Biomed Res Int. 2020 Jun 16;2020:2576563. doi: 10.1155/2020/2576563. eCollection 2020. Biomed Res Int. 2020. PMID: 32626736 Free PMC article.
-
Combination of CEUS and MRI for the diagnosis of periampullary space-occupying lesions: a retrospective analysis.BMC Med Imaging. 2019 Sep 2;19(1):77. doi: 10.1186/s12880-019-0376-7. BMC Med Imaging. 2019. PMID: 31477041 Free PMC article.
References
MeSH terms
LinkOut - more resources
Full Text Sources
Other Literature Sources
Medical
