

Transcriptomic Study on Ovine Immune Responses to Fasciola hepatica Infection
- PMID: 27661612
- PMCID: PMC5035020
- DOI: 10.1371/journal.pntd.0005015
Transcriptomic Study on Ovine Immune Responses to Fasciola hepatica Infection
Abstract
Background: Fasciola hepatica is not only responsible for major economic losses in livestock farming, but is also a major food-borne zoonotic agent, with 180 million people being at risk of infection worldwide. This parasite is sophisticated in manipulating the hosts' immune system to benefit its own survival. A better understanding of the mechanisms underpinning this immunomodulation is crucial for the development of control strategies such as vaccines.
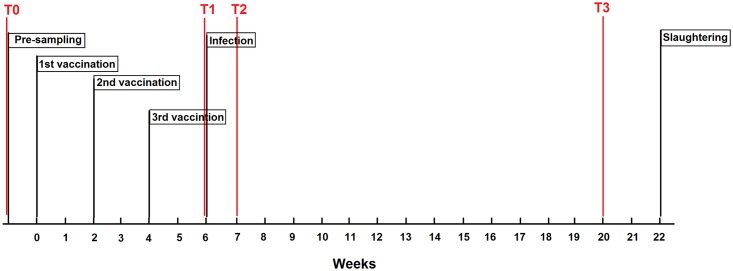
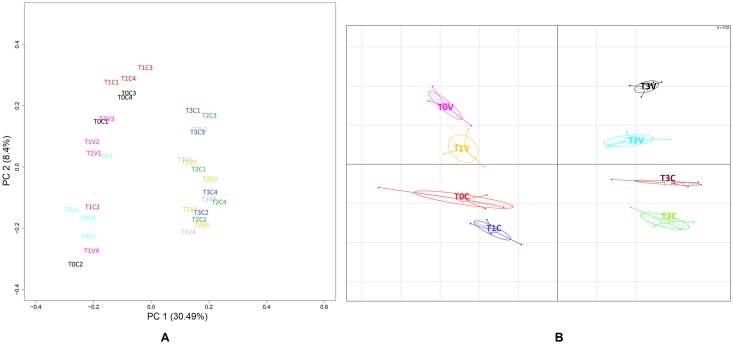
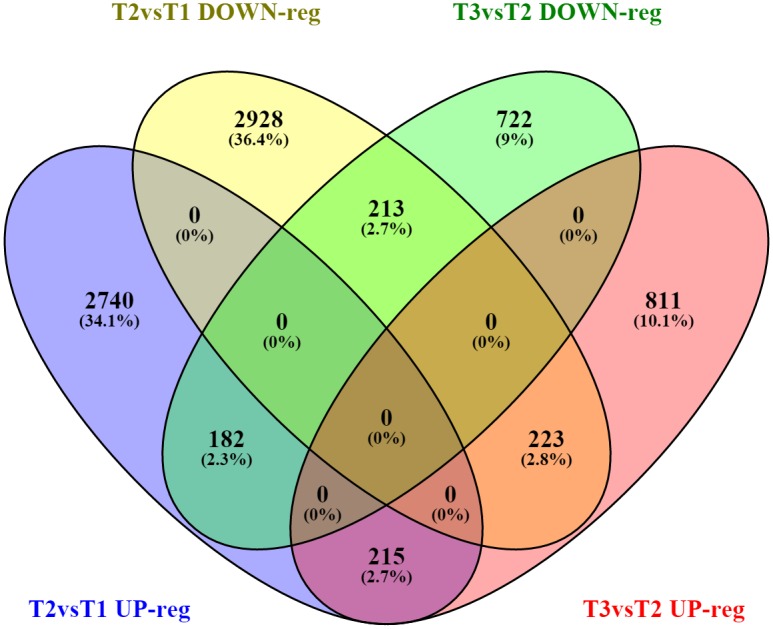
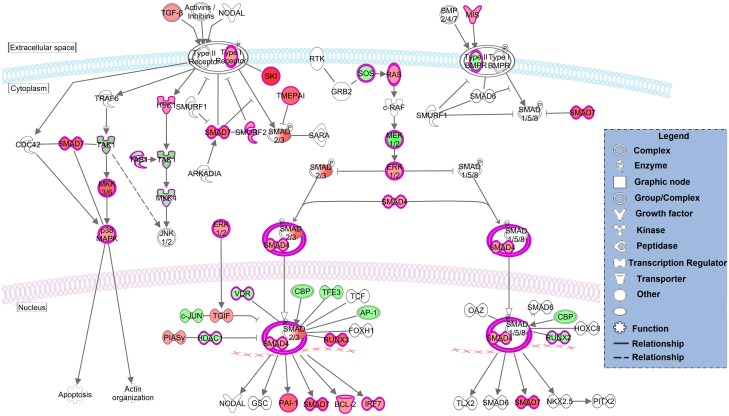
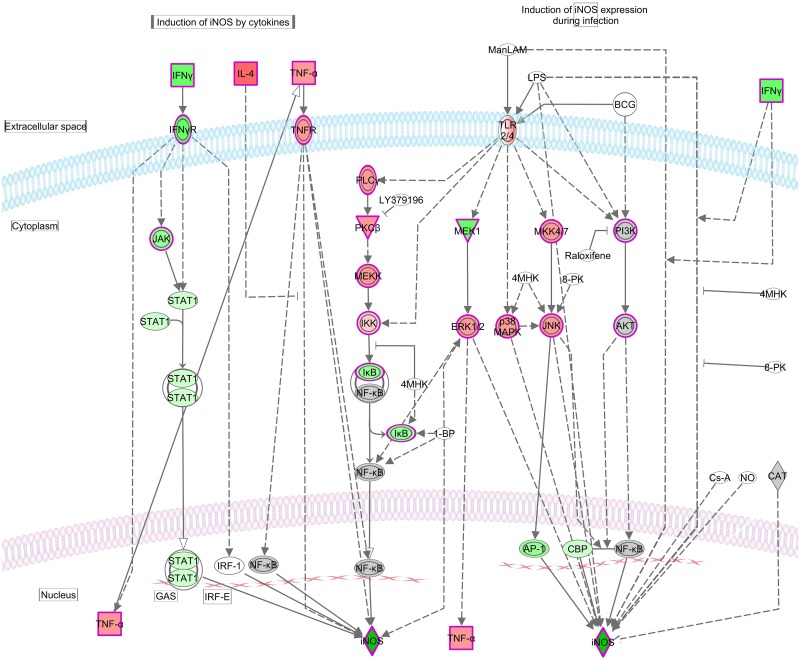
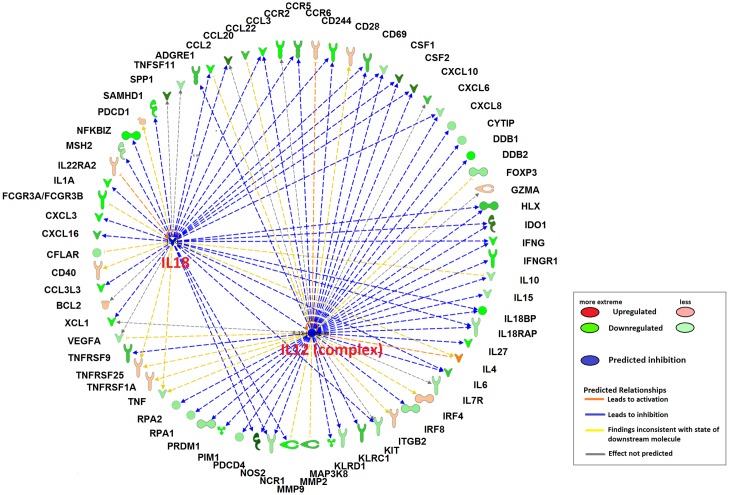
Methodology/principal findings: This in vivo study investigated the global gene expression changes of ovine peripheral blood mononuclear cells (PBMC) response to both acute & chronic infection of F. hepatica, and revealed 6490 and 2364 differential expressed genes (DEGS), respectively. Several transcriptional regulators were predicted to be significantly inhibited (e.g. IL12 and IL18) or activated (e.g. miR155-5p) in PBMC during infection. Ingenuity Pathway Analysis highlighted a series of immune-associated pathways involved in the response to infection, including 'Transforming Growth Factor Beta (TGFβ) signaling', 'Production of Nitric Oxide in Macrophages', 'Toll-like Receptor (TLRs) Signaling', 'Death Receptor Signaling' and 'IL17 Signaling'. We hypothesize that activation of pathways relevant to fibrosis in ovine chronic infection, may differ from those seen in cattle. Potential mechanisms behind immunomodulation in F. hepatica infection are a discussed.
Significance: In conclusion, the present study performed global transcriptomic analysis of ovine PBMC, the primary innate/adaptive immune cells, in response to infection with F. hepatica, using deep-sequencing (RNAseq). This dataset provides novel information pertinent to understanding of the pathological processes in fasciolosis, as well as a base from which to further refine development of vaccines.
Conflict of interest statement
The authors have declared that no competing interests exist.
Figures
Similar articles
-
Fasciola hepatica Infection in Cattle: Analyzing Responses of Peripheral Blood Mononuclear Cells (PBMC) Using a Transcriptomics Approach.Front Immunol. 2019 Aug 29;10:2081. doi: 10.3389/fimmu.2019.02081. eCollection 2019. Front Immunol. 2019. PMID: 31555289 Free PMC article.
-
Network Analysis of the Systemic Response to Fasciola hepatica Infection in Sheep Reveals Changes in Fibrosis, Apoptosis, Toll-Like Receptors 3/4, and B Cell Function.Front Immunol. 2017 Apr 25;8:485. doi: 10.3389/fimmu.2017.00485. eCollection 2017. Front Immunol. 2017. PMID: 28487699 Free PMC article.
-
Transcriptomic Analysis of Ovine Hepatic Lymph Node Following Fasciola hepatica Infection - Inhibition of NK Cell and IgE-Mediated Signaling.Front Immunol. 2021 May 28;12:687579. doi: 10.3389/fimmu.2021.687579. eCollection 2021. Front Immunol. 2021. PMID: 34122452 Free PMC article.
-
Elucidating the transcriptome of Fasciola hepatica - a key to fundamental and biotechnological discoveries for a neglected parasite.Biotechnol Adv. 2010 Mar-Apr;28(2):222-31. doi: 10.1016/j.biotechadv.2009.12.003. Epub 2009 Dec 16. Biotechnol Adv. 2010. PMID: 20006979 Review.
-
Recent advances in the diagnosis, impact on production and prediction of Fasciola hepatica in cattle.Parasitology. 2014 Mar;141(3):326-35. doi: 10.1017/S0031182013001662. Epub 2013 Nov 7. Parasitology. 2014. PMID: 24229764 Review.
Cited by
-
Fasciolosis: pathogenesis, host-parasite interactions, and implication in vaccine development.Front Vet Sci. 2023 Dec 11;10:1270064. doi: 10.3389/fvets.2023.1270064. eCollection 2023. Front Vet Sci. 2023. PMID: 38149297 Free PMC article. Review.
-
Fasciola hepatica Infection in Cattle: Analyzing Responses of Peripheral Blood Mononuclear Cells (PBMC) Using a Transcriptomics Approach.Front Immunol. 2019 Aug 29;10:2081. doi: 10.3389/fimmu.2019.02081. eCollection 2019. Front Immunol. 2019. PMID: 31555289 Free PMC article.
-
Expression of free radicals by peritoneal cells of sheep during the early stages of Fasciola hepatica infection.Parasit Vectors. 2018 Sep 6;11(1):500. doi: 10.1186/s13071-018-3072-5. Parasit Vectors. 2018. PMID: 30189903 Free PMC article.
-
Developmental Regulation and Functional Prediction of microRNAs in an Expanded Fasciola hepatica miRNome.Front Cell Infect Microbiol. 2022 Feb 10;12:811123. doi: 10.3389/fcimb.2022.811123. eCollection 2022. Front Cell Infect Microbiol. 2022. PMID: 35223544 Free PMC article.
-
Transcriptomic meta-analysis reveals unannotated long non-coding RNAs related to the immune response in sheep.Front Genet. 2022 Nov 22;13:1067350. doi: 10.3389/fgene.2022.1067350. eCollection 2022. Front Genet. 2022. PMID: 36482891 Free PMC article.
References
-
- Mas-Coma S, Bargues MD, Valero MA. Fascioliasis and other plant-borne trematode zoonoses. Int J Parasitol. 2005;35(11–12):1255–1278. - PubMed
LinkOut - more resources
Full Text Sources
Other Literature Sources
Molecular Biology Databases
Miscellaneous
