. 2016 Sep 22;167(1):111-121.e13.
doi: 10.1016/j.cell.2016.09.004.

sRNA-Mediated Control of Transcription Termination in E. coli

Affiliations

sRNA-Mediated Control of Transcription Termination in E. coli

Nadezda Sedlyarova et al. Cell. .

Abstract

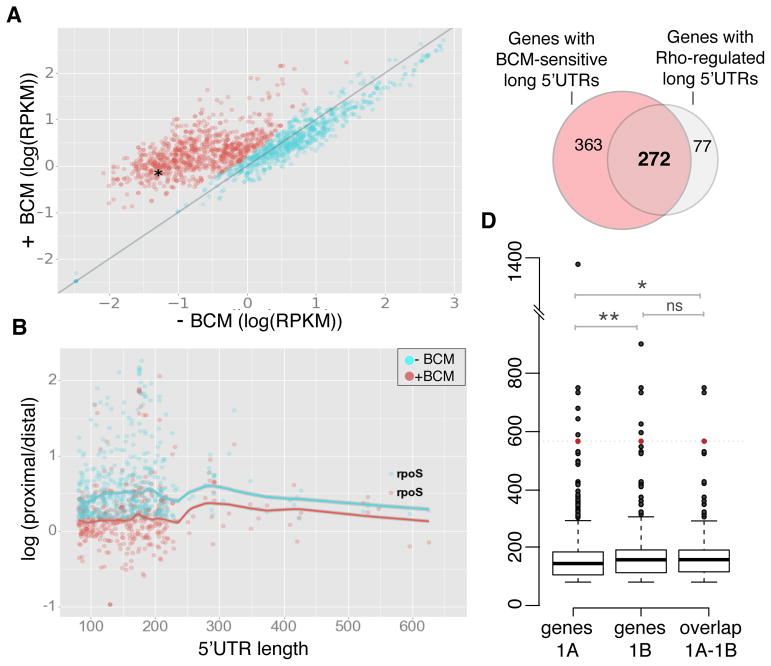
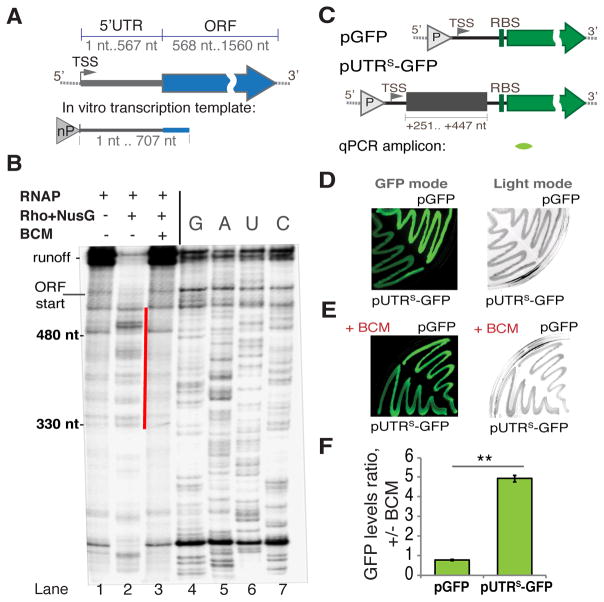
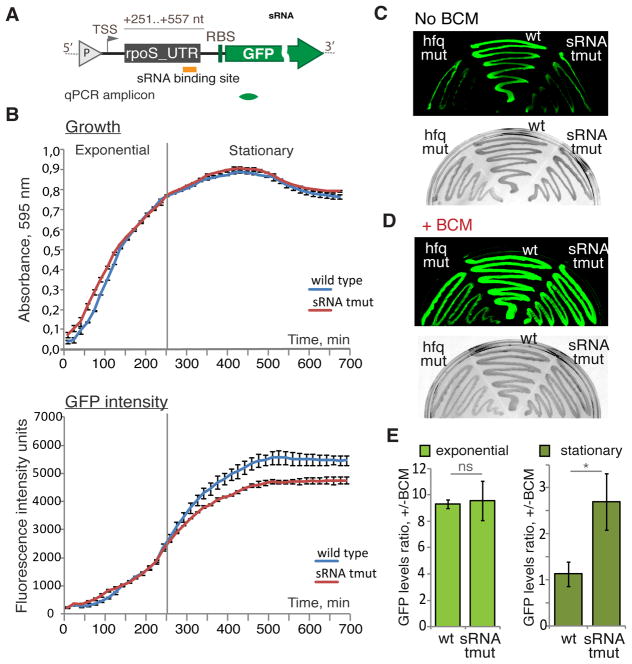
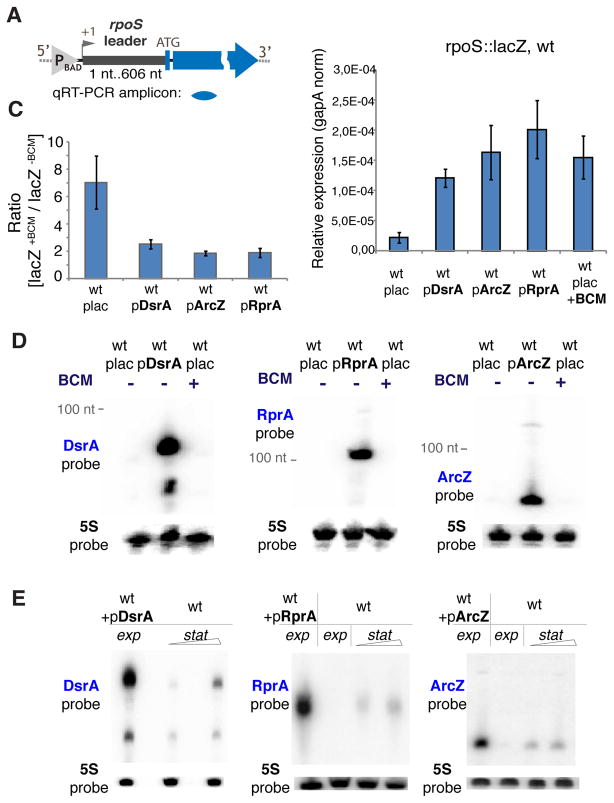
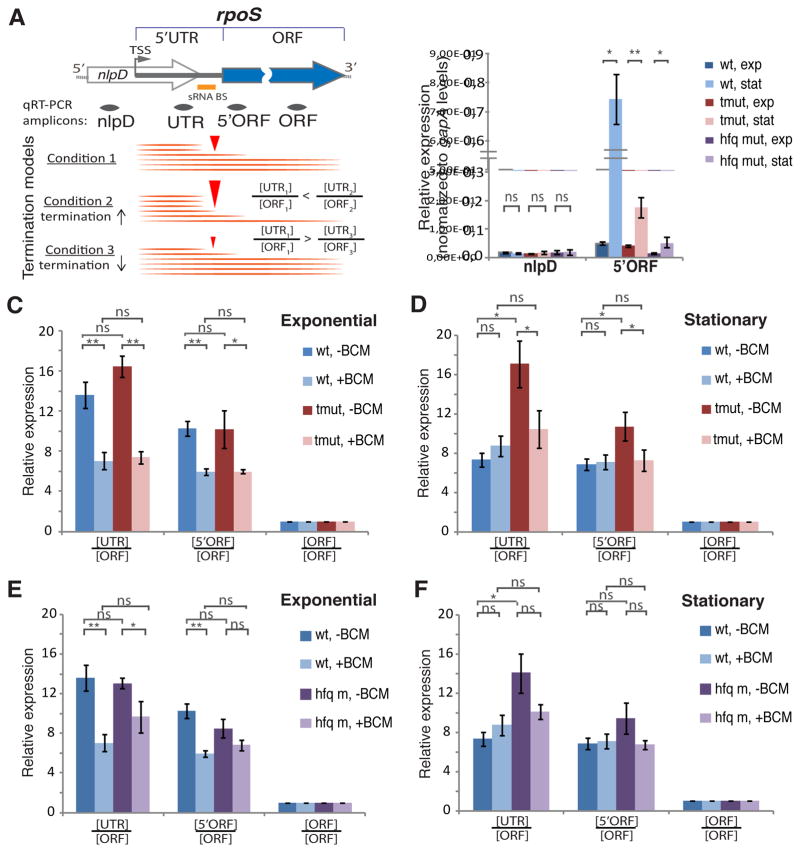
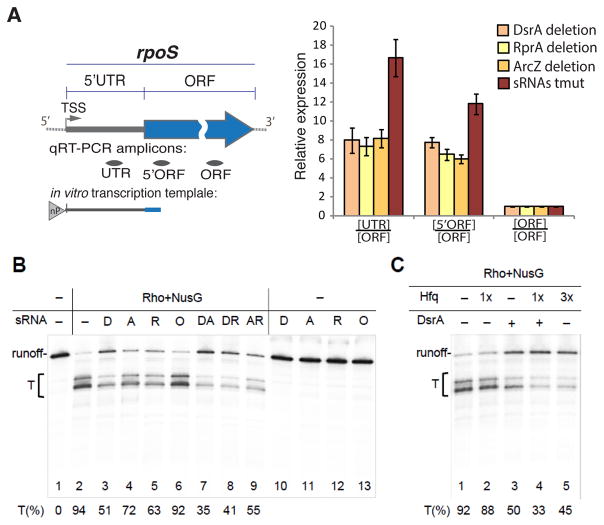
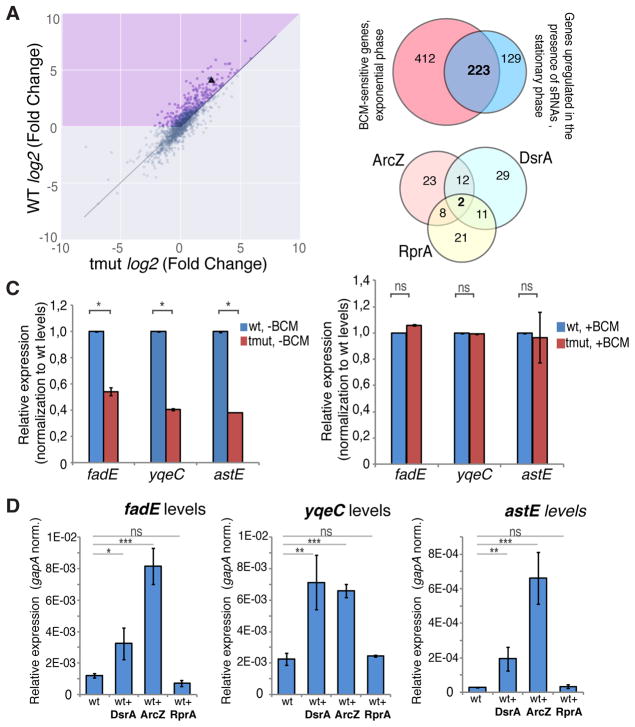
Bacterial small RNAs (sRNAs) have been implicated in various aspects of post-transcriptional gene regulation. Here, we demonstrate that sRNAs also act at the level of transcription termination. We use the rpoS gene, which encodes a general stress sigma factor σ(S), as a model system, and show that sRNAs DsrA, ArcZ, and RprA bind the rpoS 5'UTR to suppress premature Rho-dependent transcription termination, both in vitro and in vivo. sRNA-mediated antitermination markedly stimulates transcription of rpoS during the transition to the stationary phase of growth, thereby facilitating a rapid adjustment of bacteria to global metabolic changes. Next generation RNA sequencing and bioinformatic analysis indicate that Rho functions as a global "attenuator" of transcription, acting at the 5'UTR of hundreds of bacterial genes, and that its suppression by sRNAs is a widespread mode of bacterial gene regulation.

Keywords: Rho; Transcription termination; antitermination; sRNA; sigma factor; stress response.


Figures

Figure 1
Figure 1. Long E. coli 5′UTRs are the Target by Rho
(A) Scatter plot of transcription levels of first 300 nt in 1203 5′UTRs longer than 80 nt as Log(RPKM) (logarithm of the number of reads per kilobase of transcript per million mapped reads) in the exponentially growing cells with (+) vs without (−) BCM. The fraction of genes with BCM-upregulated long 5′UTRs (635 genes, marked in red) was identified using a Gaussian mixture model clustering (see Methods and Resources). rpoS 5′UTR is marked by an asterisk. (B) Scatter plot of log(proximal/distal) (proximal and distal to the transcription start site) for long UTRs with the ratio (proximal/distal) >1.5 in the presence or absence of BCM. Solid lines represent lowess (local weighted regression) curve fitted to −BCM and +BCM samples with 95% CI (confidence intervals) indicated by shading. See Figure S1C for details. (C) Venn diagram shows the overlap between the BCM-sensitive (BCM-upregulated) genes with long 5′UTRs (see 1A) and those with Rho-mediated termination within the 5′ UTRs (see 1B). (D) Box and whisker plots showing the distribution of 5′UTR sizes for BCM-responsive genes with long leader sequences (labeled as “genes 1A”), 5′UTRs subject to Rho termination (labeled as “genes 1B”) and the set of overlapping genes between these two sets (labeled as “overlap 1A–1B”, see also C). Median for the 5′UTR sizes of all BCM-responsive genes with long leader sequences is 145 nt (genes 1A). The median size of identified 5′UTRs subject to Rho termination is 158 nt (genes 1B) and the overlap between the two sets is 158.5 nt (overlap 1A–1B). The significance was tested using non–parametric Wilcoxon-Mann-Whitney test; ** P < 0.01, * P < 0.05, ns – non-significant. rpoS (5′UTR length is 567 nt) is present in all three sets and is shown in red.
Figure 2
Figure 2. Rho-dependent Termination within the rpoS 5′UTR
(A) A diagram of E. coli rpoS with its 5′UTR and ORF indicated. A genome-derived template for in vitro transcription (B) that includes the entire rpoS 5′UTR and the first 140 nt of ORF is depicted below, “nP” indicates the location of the native promoter driving rpoS transcription. TSS - transcription start site. (B) A representative single round transcription (6% TBE-UREA gel) on the rpoS template (see A). Pre-formed elongation complexes were chased without (lane 1) or with Rho and NusG (without BCM - lane 2; with BCM - lane 3). Gel densitometry indicates that the efficiency of termination without BCM is ~87% (see also Figure S3). The most prominent termination products are marked with the red line. To determine the location of termination sites RNA sequencing was performed using 3′ dNTPs (lanes 4–7). The beginning of ORF and runoff are indicated. (C) Reporter constructs. Upper panel: pGFP construct with the GFP reporter only. Lower panel: the transcriptional fusion pUTRS-GFP used to test the effect of the rpoS 5′UTR (fragment +251–447 nt) on Rho termination (see also Figure S2A). “P” indicates the location of a constitutive promoter. TSS – the transcription start site; RBS – the ribosome-binding site. The location of qRT-PCR amplicon is indicated below (green). (D and E) Representative results from the GFP plate assay. DH5a cells transformed with pGFP or pUTRS-GFP grew on LB agar plates without (D) or with 8 μg/ml BCM (E) and the fluorescence intensity was measured (GFP mode, left panel). The same plates were also captured under visible light (Light mode, right panel). (F) qRT-PCR data for exponentially growing cells transformed with pGFP or pUTRS-GFP. Ratio of gfp RNA levels +/− BCM is plotted. Values are means ±SD, n = 3; ** P < 0.01 (Student’s t-test, equal variance).
Figure 3
Figure 3. sRNAs Control Rho-dependent Termination within the rpoS 5′UTR Reporter
(A) A diagram of the pUTRsRNA-GFP construct (see also Figure S2B) that includes the rpoS 5′UTR fragment (+251–557 nt) with the position of the sRNAs-binding site indicated (orange bar). “P” (grey triangle) indicates the location of the constitutive promoter. TSS - transcription start site; RBS – ribosome-binding site. The location of the qRT-PCR amplicon is indicated below (green). (B) sRNA effect on transcription as detected by real-time fluorescence. E. coli strains PM1409 (wild type, blue) and PM1417 (dsrA rprA arcZ triple deletion mutant – tmut, red) transformed with pUTRsRNA-GFP (see also Figure S2B) grew in LB for more than 11 hours while cell density (upper panel) and fluorescence intensities (lower panel) were simultaneously monitored. The grey vertical line indicates the boundary between exponential and stationary phases. For each time point the values represent means ±SD, n = 3. (C and D) Representative results from the GFP plate assay. PM1409 (wt), PM1417 (tmut), and the hfq deletion mutant (PM1419) transformed with pUTRsRNA-GFP grew on LB agar plates without (C) or with 8 μg/ml BCM (D) and the fluorescence intensity was measured (GFP mode – upper panel). The same plates were also captured under visible light (light mode – lower panel). (E) qRT-PCR data for exponentially (left panel) and stationary (right panel) growing cell transformed with pUTRsRNA-GFP. Ratio of gfp RNA levels +/− BCM is plotted. Values are means ±SD, n = 3; * P < 0.05; ns - not significant (Student’s t-test, equal variance).
Figure 4
Figure 4. sRNAs Overexpression Stimulates rpoS Leader-driven Transcription by Inhibiting Rho
(A) Upper panel: the rpoS::lacZ chromosomal reporter fusion. “P” indicates the inducible pBAD promoter. Position +1 indicates the location of transcription start site; ATG – translation start codon. The location of qRT-PCR amplicon is indicated below. Lower panel: transcript levels of lacZ measured in wt strain carrying the rpoS::lacZ chromosomal fusion during mid-exponential phase. Where indicated the expression of plasmid-borne sRNAs was induced (plac is an empty vector pBRplac), or BCM was added for 15 min. qRT-PCR values were normalization to that of a housekeeping gapA gene. Values represent means ±SD from three independent experiments. (B) The effect of BCM on lacZ transcript levels. Where indicated DsrA, ArcZ and RprA were induced in the mid exponential phase. Afterwards, the corresponding strains were incubated with or without BCM followed by total RNA extraction. Ratios of lacZ transcript levels +/− BCM for each individual strain were calculated using qRT-PCR as in (A). (C) Nothern blot analysis: levels of DsrA, RprA and ArcZ in the exponentially grown WT (PM1409) without sRNA overexpression (transformed with the parent empty pBRplac plasmid), after sRNA overexpression (wt+pDsrA/wt+pRprA/wt+pArcZ), and after treatment with BCM (wt+BCM). 5S probe – loading control. (D) Nothern blot analysis: levels of overexpressed DsrA, RprA and ArcZ in the exponentially grown WT (PM1409 transformed with indicated pBRplac-derived sRNA construct) and endogenous sRNA accumulation in WT (PM1409 with empty pBRplac plasmid) grown to medium/late stationary phase. 5S probe – loading control.
Figure 5
Figure 5. sRNAs Act on Chromosomal rpoS 5′UTR
(A) A diagram of rpoS with its ORF and 5′UTR located within the nlpD gene. The locations of qRT-PCR amplicons are shown below. The orange bar marks the position of the DsrA/RprA/ArcZ binding site (sRNA BS). TSS - transcription start site. The lower panel shows the approach for an unbiased estimation of Rho-dependent termination within the rpoS leader that relies on changing [UTR]/[ORF] ratios (internal normalization within rpoS transcript). An increase in the [UTR]/[ORF] ratio corresponds to the increased termination efficiency, whereas a decrease in the [UTR]/[ORF] ratio corresponds to the decreased termination efficiency. (B) Levels of nlpD and 5′-end-proximal rpoS ORF measured for the wt, triple sRNA deletion mutant (tmut), and hfq deletion mutant (hfq m) in exponential and stationary phases of growth. qRT-PCR values are normalized to that of the housekeeping gapA gene. Values represent means ±SD, n ≥ 3; ** P < 0.01; * P< 0.05; ns - not significant (Student’s t-test, equal variance). (C and D) Transcript levels of different rpoS regions measured for the wt and triple sRNA deletion mutant (tmut) in exponential (C) and stationary (D) phase before and after BCM treatment (15 min, 50 μg/ml). qRT-PCR values are normalized to that of the rpoS ORF amplicon so that [ORF]/[ORF] equals to 1 for each strain/condition. Values represent means ±SD, n ≥ 3; *** P < 0.001; ** P < 0.01; * P< 0.05; ns - not significant (Student’s t-test, equal variance). (E and F) Transcript levels of different rpoS regions measured for wt and hfq deletion mutant in exponential (E) and stationary (F) phase before and after BCM treatment (15 min, 50 μg/ml). qRT-PCR data with internal rpoS transcript normalization to ORF amplicon levels are shown. qRT-PCR values are normalized to that of the rpoS ORF amplicon. [ORF]/[ORF] equals to 1 for each strain/condition. Values represent means ±SD, n ≥ 3; *** P < 0.001; ** P < 0.01; * P< 0.05; ns - not significant (Student’s t-test, equal variance).
Figure 6
Figure 6. Reconstitution of sRNA-mediated Antitermination
(A) A diagram of the E. coli rpoS gene with its 5′UTR and ORF indicated. The genome-derived template for in vitro transcription (B) includes the entire rpoS 5′UTR and first 140 nt of rpoS ORF is shown below. “nP” indicates the natural RNAP driving rpoS transcription. TSS - transcription start site. The locations of qRT-PCR amplicons are depicted below as grey bars. (B) sRNAs inhibit Rho termination in vitro. Radiogram shows a representative single round transcription assay (see Experimental Procedures). Pre-formed elongation complexes were chased in the absence (lanes 1, 10–13) or presence of Rho and NusG. A bracket indicates the transcription termination zone (T). The efficiency of Rho-dependent termination was estimated in the absence (lanes 2) or in the presence of 1 M of different sRNAs (lanes 3–6), including DsrA (D), RprA (R), ArcZ (A), and OxyS (O). Pair combinations of sRNAs (each of 1 M) were used as indicated (lanes 7–9). The percentage of termination (T%) was calculated for each reaction as a ratio between the amount of radioactivity in the bands corresponding to the termination products (T) and the total radioactivity signal of the termination and readthrough bands. Values represent means from 3 independent experiments. (C) Hfq assists DsrA-mediated antitermination. A single round transcription assay was performed as in (B), except for 25 nM (1x) or 75 nM (3x) Hfq were added during the chase reaction. (D) Transcript levels of different rpoS regions measured for individual sRNA deletion strains and the triple sRNAs deletion (tmut) in stationary phase. qRT-PCR values are normalized to that of the rpoS ORF amplicon. Values represent means ±SD, n ≥ 3; *** P < 0.001; ** P < 0.01; * P< 0.05; ns - not significant (Student’s t-test, equal variance).
Figure 7
Figure 7. sRNA-mediated Antitermination is a Global Phenomenon
(A) Scatter plot of gene expression changes upon transition to the stationary phase (log2 Fold Change) in the wild type (WT) vs triple sRNAs deletion mutant. Differential gene expression analysis was performed using the DESeq2 software package for stationary vs exponential phase. Only the genes with long (>80 nt) 5′UTRs are shown. rpoS is marked by a triangle. The purple shaded area indicates genes with a greater upregulation during stationary phase in wt cells than in the sRNAs mutant strain. (B) Upper panel: Venn diagram shows the overlap between the long leader genes upregulated in the exponential phase due to BCM treatment and those, which upregulation in the stationary phase depends on DsrA, RprA and ArcZ. Lower panel: Venn diagram shows the predicted sRNA target distribution in the 223 genes, which regulation depends on both Rho and mentioned sRNAs. (C) Transcript levels of fadE, yqeC and astE in the wt and sRNAs triple deletion mutant (tmut) measured in stationary phase in the absence (left) or presence of BCM (right). qRT-PCR data with normalization against corresponding wt strain gene levels. Values represent means ±SD, n = 3; * P < 0.05; ns, not significant (Student’s t-test, equal variance). (D) Transcript levels of fadE, yqeC and astE in the exponentially grown wt cells with or without overexpression of DsrA, ArcZ and RprA. qRT-PCR values are normalized to that of a housekeeping gapA gene. Values represent means ±SD, n = 3; ** P < 0.01, *** < 0.001, ns - not significant (Student’s t-test, equal variance).

References

    1. Anders S, Pyl PT, Huber W. HTSeq--a Python framework to work with high-throughput sequencing data. Bioinformatics. 2015;31:166–169. - PMC - PubMed
    1. Argaman L, Hershberg R, Vogel J, Bejerano G, Wagner EGH, Margalit H, Altuvia S. Novel small RNA-encoding genes in the intergenic regions of Escherichia coli. Curr Biol. 2001;11:941–950. - PubMed
    1. Battesti A, Majdalani N, Gottesman S. The RpoS-mediated general stress response in Escherichia coli. Annu Rev Microbiol. 2011;65:189–213. - PMC - PubMed
    1. Battesti A, Majdalani N, Gottesman S. Stress sigma factor RpoS degradation and translation are sensitive to the state of central metabolism. Proc Natl Acad Sci U S A. 2015;112:5159–5164. - PMC - PubMed
    1. Bossi L, Schwartz A, Guillemardet B, Boudvillain M, Figueroa-Bossi N. A role for Rho-dependent polarity in gene regulation by a noncoding small RNA. Genes Dev. 2012;26:1864–1873. - PMC - PubMed

SUPPLEMENTAL REFERENCES

    1. Battesti A, Majdalani N, Gottesman S. Stress sigma factor RpoS degradation and translation are sensitive to the state of central metabolism. Proc Natl Acad Sci U S A. 2015;112:5159–5164. - PMC - PubMed
    1. Brown L, Elliott T. Mutations that increase expression of the rpoS gene and decrease its dependence on hfq function in Salmonella typhimurium. J Bacteriol. 1997;179:656–662. - PMC - PubMed
    1. Epshtein V, Dutta D, Wade J, Nudler E. An allosteric mechanism of Rho-dependent transcription termination. Nature. 2010;463:245–249. - PMC - PubMed
    1. Møller T, Franch T, Højrup P, Keene DR, Bächinger HP, Brennan RG, Valentin-Hansen P. Hfq: A Bacterial Sm-like Protein that Mediates RNA-RNA Interaction. Mol Cell. 2002;9:23–30. - PubMed
    1. Peng Y, Soper TJ, Woodson SA. Positional effects of AAN motifs in rpoS regulation by sRNAs and Hfq. J Mol Biol. 2014;426:275–285. - PMC - PubMed

Publication types

MeSH terms