. 2016 Sep 22;167(1):219-232.e14.
doi: 10.1016/j.cell.2016.09.006.

Inheritable Silencing of Endogenous Genes by Hit-and-Run Targeted Epigenetic Editing

Affiliations

Inheritable Silencing of Endogenous Genes by Hit-and-Run Targeted Epigenetic Editing

Angelo Amabile et al. Cell. .

Abstract

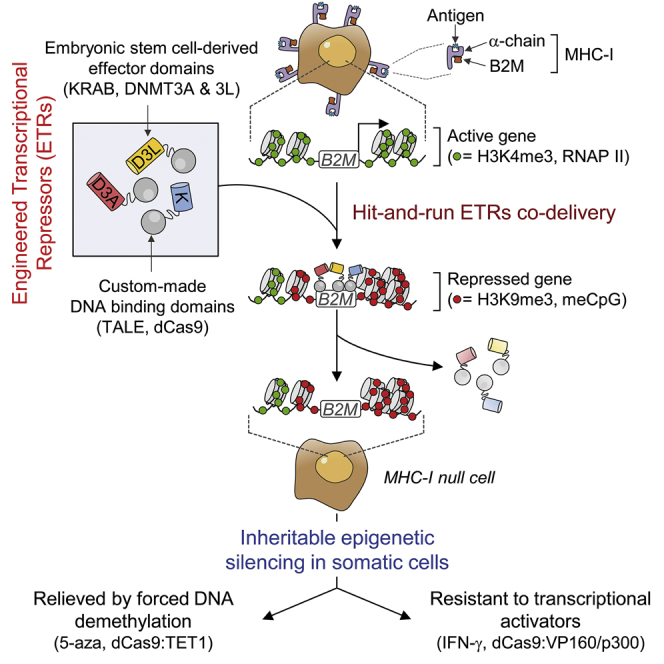
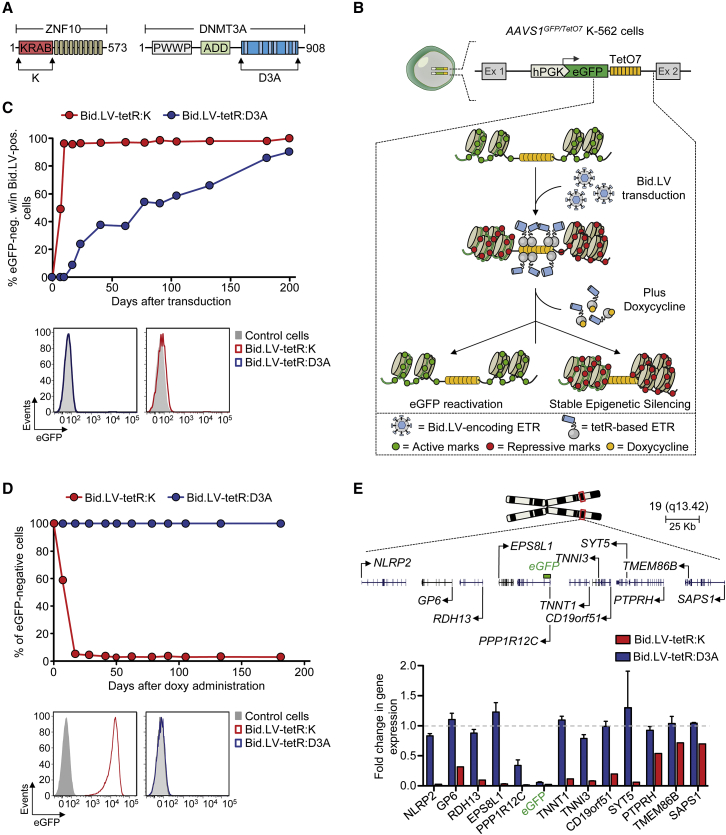
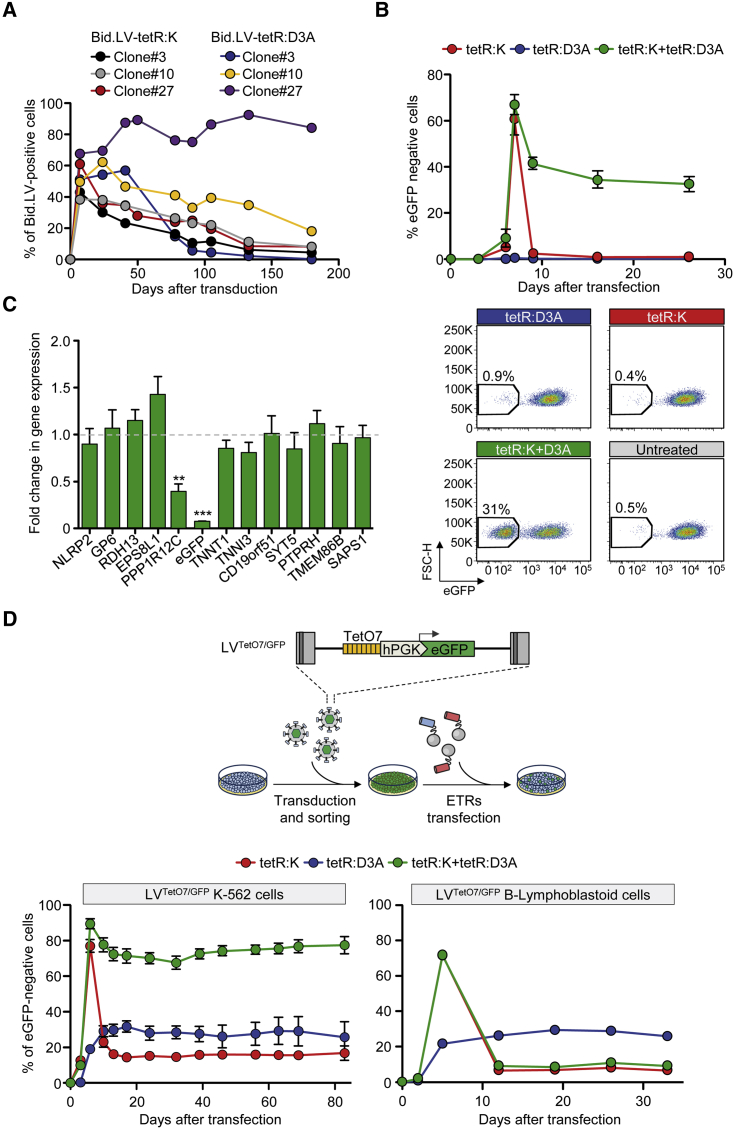
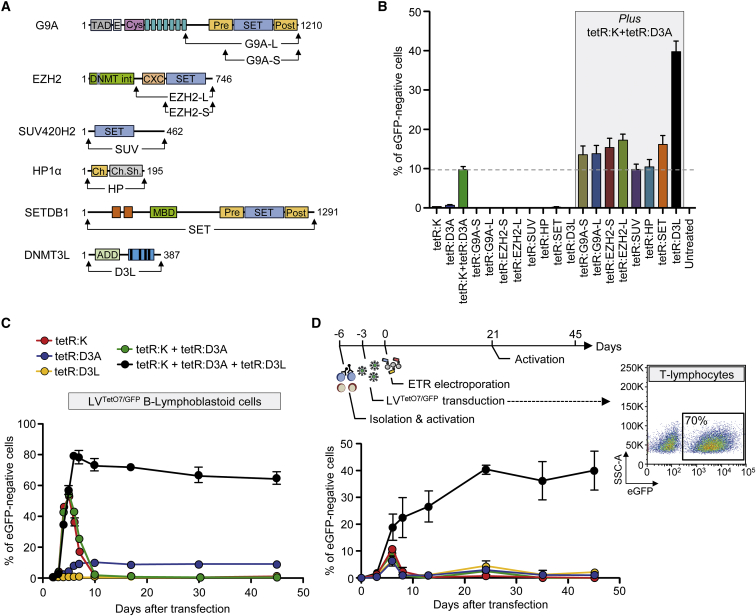
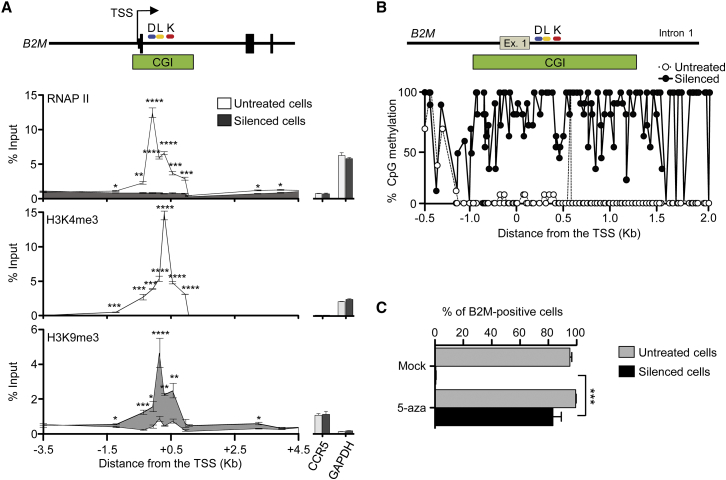
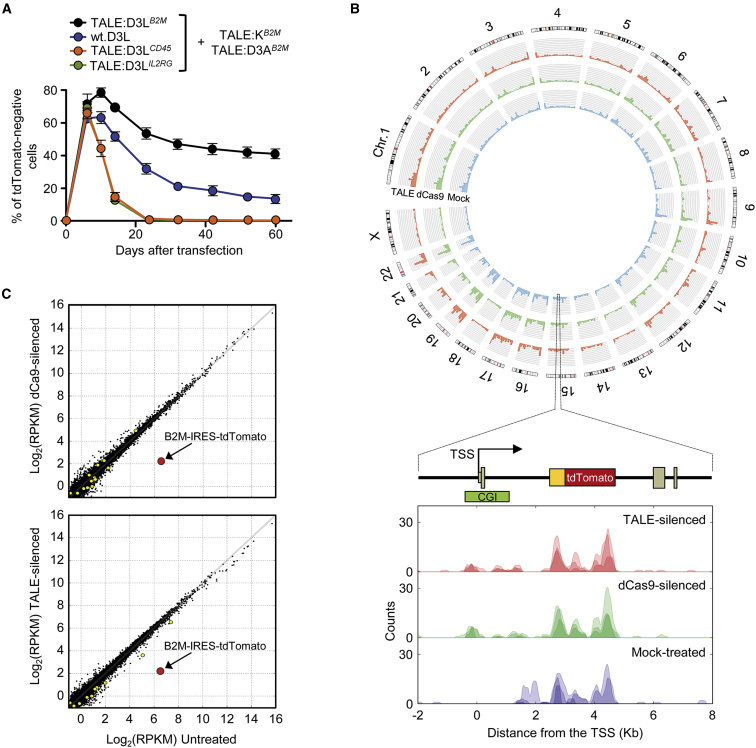
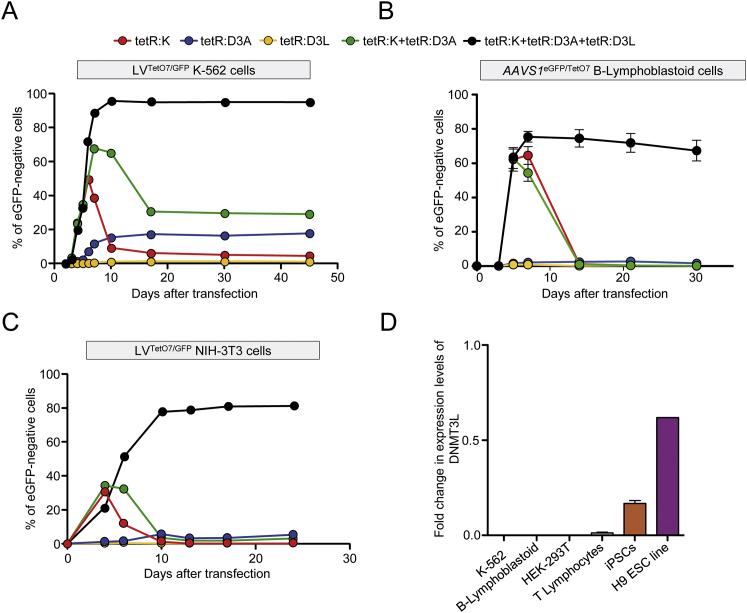
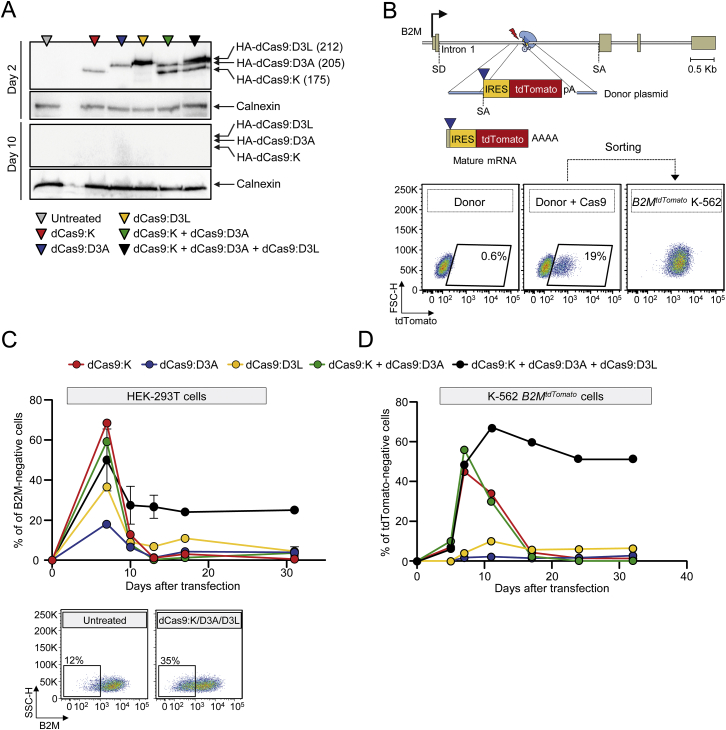
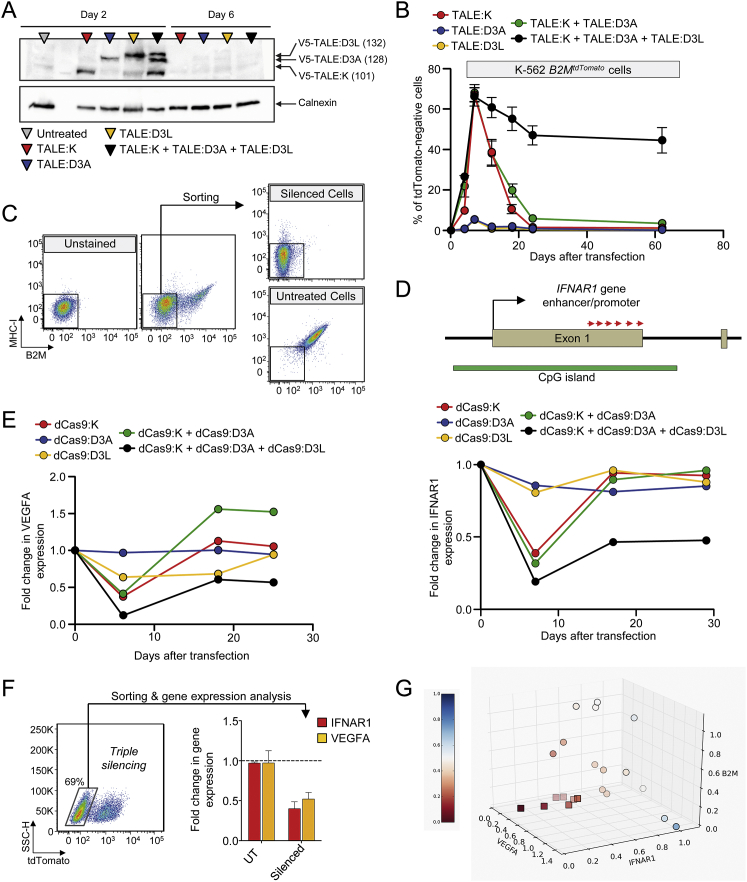
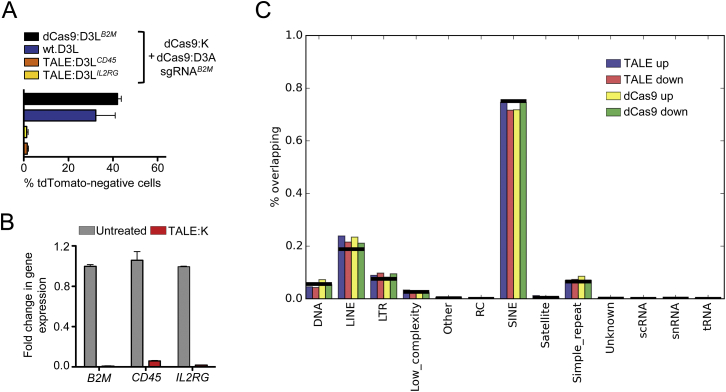
Gene silencing is instrumental to interrogate gene function and holds promise for therapeutic applications. Here, we repurpose the endogenous retroviruses' silencing machinery of embryonic stem cells to stably silence three highly expressed genes in somatic cells by epigenetics. This was achieved by transiently expressing combinations of engineered transcriptional repressors that bind to and synergize at the target locus to instruct repressive histone marks and de novo DNA methylation, thus ensuring long-term memory of the repressive epigenetic state. Silencing was highly specific, as shown by genome-wide analyses, sharply confined to the targeted locus without spreading to nearby genes, resistant to activation induced by cytokine stimulation, and relieved only by targeted DNA demethylation. We demonstrate the portability of this technology by multiplex gene silencing, adopting different DNA binding platforms and interrogating thousands of genomic loci in different cell types, including primary T lymphocytes. Targeted epigenome editing might have broad application in research and medicine.

Keywords: B2M-null cells; CRISPR/Cas9; DNA methylation; DNMT3L; KRAB-ZFP/KAP1; TALE; TET1; epigenetic editing; gene therapy; permanent gene silencing.


Figures

None
Graphical abstract
Figure 1
Figure 1
Activity of the KRAB- and DNMT3A-Based ETRs (A) Schematics of the ZNF10 and DNMT3A proteins indicating the KRAB (K) and the catalytic domain of DNMT3A (D3A). (B) Experimental cell model used to assess activity of candidate effector domains. Top drawing shows a K-562 cell clone containing bi-allelic insertion of the hPGK-eGFP.TetO7 cassette into intron 1 of the PPP1R12C gene (a.k.a. AAVS1). The boxed bottom drawing shows the epigenetic state of the indicated region in the following experimental conditions: (1) in untreated cells, in which the region is decorated by active epigenetic marks and eGFP is expressed; (2) upon transduction with a Bid.LV expressing a tetR-based ETR, whose binding to the TetO7 element leads to deposition of repressive epigenetic marks and silencing of the cassette; (3) and upon conditional release (by doxy administration) of the ETR from the TetO7 element. In this setting, the repressive marks previously deposed by the ETR can be either erased or propagated to the cell progeny by the endogenous cell machinery, thereby leading to transcriptional reactivation or permanent silencing of eGFP expression, respectively. hPGK, human phosphoglycerate kinase gene promoter. (C) Top: graph showing the percentage of eGFP-negative cells within the indicated Bid.LV-transduced cell populations cultured without doxy. Data are represented as mean of AAVS1GFP/TetO7 K-562 cell clones #10 and #27 of Figure S1D. Bottom: representative flow cytometry histograms of the indicated cell populations at termination of the experiment. (D) Top: silenced cells from (C) were sorted and cultured with doxy. The graph shows the percentage of eGFP-negative cells over time. Bottom: histograms of the indicated cell populations at termination of the experiment. (E) Top: schematic of chromosome 19 and zoom on the AAVS1 locus containing the eGFP-expression cassette. Bottom: gene expression profile of the AAVS1 locus from eGFP-negative cells transduced with the indicated Bid.LVs. The expression level of each gene was normalized to B2M and represented as fold change over a matched, untransduced AAVS1GFP/TetO7 K-562 cell clone (mean ± SEM for Bid.LV-tetR:D3A, n = 3 independent analyses; mean value for Bid.LV-tetR:K, n = 2 independent analyses). See also Figure S1 and Tables S1 and S2.
Figure 2
Figure 2
Combination of the KRAB- and DNMT3A-Based ETRs Leads to Synergistic Silencing (A) Time-course analysis of Bid.LV-expressing cells in the indicated AAVS1GFP/TetO7 K-562 cell clones. (B) Top: time-course analysis of AAVS1GFP/TetO7 K-562 cells upon transfection with mRNAs encoding for the indicated ETRs. Data show percentage of eGFP-negative cells (mean ± SEM of Clone #10 and #18 from Figure S1D each transfected in triplicate). Bottom: representative dot plots of the indicated treatments at termination of the experiment. (C) Fold change in the expression levels of the indicated genes in eGFP-negative cells sorted from the double ETRs’ transfected cells. The expression level of each gene was normalized to B2M and represented as fold change over untreated K-562 clones. Data are represented as mean ± SEM (n = 3 independent cell sortings from Clone #10 of [B]; statistical analysis by unpaired Student’s t test). (D) Top: schematic of the experimental procedure used to generate the LVTetO7/GFP cell lines and to assess activity of the ETRs. Bottom: time-course analysis of LVTetO7/GFP K-562 cells (left) or B-lymphoblastoid cells (right) upon transfection with mRNA encoding for the ETRs. Data show percentage of eGFP-negative cells (mean ± SEM; n = 3 independent transfections for each treatment condition). See also Figure S2.
Figure 3
Figure 3
Addition of the DNMT3L-Based ETR to the Double tetR:K tetR:D3A Combination Improves Silencing Efficiency (A) Schematics of the indicated proteins showing the selected effector domains. (B) Histogram showing the percentage of eGFP negative LVTetO7/GFP K-562 cells at 21 days post-transfection with plasmids expressing the indicated ETRs (mean ± SEM; n = 3 of three independent transfections for each treatment condition). (C) Time-course analysis of LVTetO7/GFP B-lymphoblastoid cells upon transfection with mRNAs encoding for the indicated ETRs. Data show percentage of eGFP-negative cells (mean ± SEM; n = 3 independent transfections for each treatment condition). (D) Top: schematic of the experimental procedure used to assess activity of the ETRs in primary T lymphocytes and representative dot plot of LVTetO7/GFP T cells. Bottom: time-course analysis of LVTetO7/GFP T lymphocytes upon transfection with mRNAs encoding for the indicated ETRs. Data show percentage of eGFP-negative cells as calculated by setting to 100% the percentage of eGFP-positive cells in the untransfected LVTetO7/GFP condition (mean ± SEM of two independent blood donors each transfected in duplicate). See also Figure S3 and Table S1.
Figure 4
Figure 4
Epigenetic Silencing of Human Endogenous Genes (A) Top: schematics of the B2MtdTomato gene depicting in the enlarged area the relative order and orientation of binding of dCas9-based ETRs complexed with sgRNAs. CGI, CpG island. Bottom: representative dot plots of B2MtdTomato K-562 cells either before (left) or after (right) ETR silencing. Analyses at 30 days post-ETR transfection. (B) Silencing activity of the indicated sgRNAs (either in pools or as individual sgRNAs) targeting the promoter/enhancer region of B2M (red arrows in the top schematic indicate orientation of the sgRNAs) in B2MtdTomato K-562 and HEK-293T cells at day 30 post-silencing. Data show percentage of B2M or tdTomato negative cells (mean ± SEM; n = 4 independent transfections for each treatment condition). TSS, transcription start site. (C) Top: schematic of the B2M promoter/enhancer region depicting the relative order of binding of the indicated TALE-based ETRs. Bottom: time-course analysis of HEK-293T cells upon transfection with plasmids expressing the indicated ETRs. Data show percentage of B2M-negative cells (mean ± SEM; n = 3 independent transfections for each treatment condition). (D) Representative dot plots of HEK-293T cells at day 30 from the indicated treatments. (E) Fold change in the expression levels of B2M in B2M-negative HEK-293T cells sorted from the indicated conditions. Data are represented as mean ± SEM (n = 3 analyses performed on the indicated populations; for silenced/disrupted cells, each population was sorted from three independent transfection experiments; statistical analysis by unpaired Student’s t test). (F) Top: schematic of the B2M locus. Bottom: expression profile of the B2M locus of HEK-293T cells sorted from the indicated conditions. The expression level of the indicated genes was normalized to HPRT1 and represented as fold change relative to the B2M levels in untreated cells (calibrator). Data are represented as mean ± SEM (n = 3 analyses performed on the indicated populations; for silenced cells, each population was sorted from three independent transfection experiments; statistical analysis by unpaired Student’s t test). (G) Fold change in the expression levels of the indicated genes in K-562 cells co-transfected or not with plasmids expressing the triple dCas9-based ETRs and sgRNAs targeting the indicated genes. Fold changes are represented relative to the matched untreated control (HPRT1 as normalizer; mean ± SEM; n = 6 independent transfections for each treatment condition). Levels of significance were evaluated with 1-tailed paired t test using values relative to the average of untreated samples. Analyses at 20 days post-transfection. See also Figure S4 and S5 and Table S3.
Figure 5
Figure 5
Epigenetic Editing of the ETR Target Gene (A) Chromatin immunoprecipitation followed by qPCR (ChIP-qPCR) analysis for RNAP II, H3K4me3, and H3K9me3 on the B2M gene of untreated and silenced HEK-293T cells. Data show fold enrichment over the input (mean ± SEM; n = 3 analyses performed on the indicated populations; for silenced cells, each population was sorted from three independent transfection experiments; statistical analysis by unpaired Student’s t test). Right histograms show percentage of input for an unrelated expressed (GAPDH) or not-expressed (CCR5) gene. The relative position of the TALE-based ETRs on B2M (D, L, and K) is shown. (B) Bisulfite analysis of the B2M region depicted in the top schematic from untreated and silenced HEK-293T cells. Data show percentage of CpG methylation. (C) Percentage of B2M positive HEK-293T cells at day 7 after the indicated treatments (mean ± SEM; n = 3 independent treatments; statistical analysis by unpaired Student’s t test).
Figure 6
Figure 6
Epigenetic Silencing Is Resistant to External Transcriptional Activation Stimuli and Can Be Reverted by Targeted DNA Demethylation (A) Representative dot plots of B2MtdTomato K-562 cells treated as indicated (analyses at least at 21 days post-treatment) or upon cell sorting. (B) Top: flow cytometry histograms showing the levels of B2M expression in control or B2M-silenced HEK-293T cells upon exposure or not to IFN-γ. Bottom: expression profile of the indicated genes from the IFN-γ treated cells shown above. The expression level of the indicated genes was normalized to HPRT1 and represented as fold change relative to untreated cells (calibrator). Data are represented as mean ± SEM (n = 3 independent treatments). See also Figure S6 and Table S4.
Figure 7
Figure 7
Whole-Genome Profiling of Differential DNA Methylation and mRNA Expression (A) Time-course analysis of B2MtdTomato K-562 cells upon transfection with plasmids encoding for the indicated TALE-based ETRs with or without WT.D3L. In apex are indicated the TALE target genes. Data show percentage of tdTomato-negative cells (mean ± SEM; n = 3 independent transfections). (B) Top: circos plot showing whole-genome MeDIP-seq profiles of TALE-silenced (red), dCas9-silenced (green), and mock-treated B2MtdTomato K-562 cells (blue). Bottom: the methylation status of the B2MtdTomato locus in the indicated samples is shown. Three replicates are represented in each pileup: pileup of aligned reads were smoothed using a Gaussian window. (C) Comparison of expression levels in mock-treated versus dCas9- (top) or TALE-silenced (bottom) cells. Values are expressed in log2 of read per kilobase per million (RPKM) of mapped reads. Black dots represent genes expressed at comparable levels in all conditions; yellow circles represent genes differentially regulated under a FDR < 0.01; red circle represents the B2M-IRES-tdTomato transcript. See also Figure S7 and Tables S5, S6, and S7.
Figure S1
Figure S1
Generation of the AAVS1GFP/TetO7 Reporter Cell Line and Stable Silencing by Targeted DNA Methylation, Related to Figure 1 (A) Schematic of the targeting strategy used to insert the eGFP-expression cassette containing a downstream TetO7 sequence within intron 1 of the PPP1R12C gene (aka. AAVS1). HL: homology arm left; HR: homology arm right; HDR: Homology Driven Repair; ZFNs: Zinc Finger Nucleases. (B) Gating strategy used to enrich for cells carrying homozygous insertion of the eGFP cassette into AAVS1. Left: flow cytometry dot plot showing K-562 cells at day 30 post-transfection with plasmids expressing the AAVS1-ZFNs and containing the donor sequence. Right: a representative flow cytometry dot plot of the sorted eGFPbright cells used to derive single-cell clones. (C) Histogram showing the Mean Fluorescence Intensity (MFI) levels of the indicated clonal populations derived from the sorted cells. In green are highlighted the clones selected for further molecular characterization of the integration. (D) Southern blot analysis of the indicated populations performed to identify clones containing homozygous insertion of the eGFP-cassette into AAVS1. The red arrows on top of the blot indicate clones selected for subsequent silencing experiments, as they lack signal from the wild-type AAVS1 allele while they contain Targeted Integration (TI) of the cassette. The expected molecular forms of the AAVS1 allele – either wild-type or containing the single cassette or its concatamers – are indicated on the right of the blot. (E) Schematics of the Bidirectional Lentiviral Vectors (Bid.LVs) expressing tetR:K and mOrange (top) or tetR:DNMT3A and ΔLNGFR (bottom). Ψ: LV packaging signal; SD: Splicing Donor; SA: Splicing Acceptor; mP: minimal Promoter. (F) Gating strategy used to measure the efficiency of gene silencing within the Bid.LV-transduced cells. An eGFP-negative cell clone, transduced or not with the Bid.LV, was used to set the gate for Bid.LV transduction and eGFP expression. (G) Representative dot plots of AAVS1GFP/TetO7 K-562 cells transduced with the indicated Bid.LVs and cultured in the presence of doxycycline for 200 days. (H) Time-course flow cytometry analysis of 36 independent cell clones derived from the AAVS1GFP/TetO7 K-562 cells transduced with the Bid.LV-tetR:D3A. Cells were grown for 14 weeks with doxycycline. At 11 weeks post-cloning, the populations were treated for 4 days with 5-aza, and then analyzed for eGFP reactivation by flow cytometry. (I) Representative flow cytometry dot plots of cells silenced with the Bid.LV-tetR:D3A and treated or not for 7 days with 5-aza. (J) Gene expression profile of the AAVS1 locus from eGFP-negative cells transduced with the indicated Bid.LVs. The expression level of each gene was normalized to HPRT1 and represented as fold change over matched, untransduced AAVS1GFP/TetO7 K-562 cell clone (mean ± SEM for Bid.LV-tetR:D3A, n = 3 independent analyses; mean value for Bid.LV-tetR:K, n = 2 independent analyses).
Figure S2
Figure S2
Silencing of the AAVS1GFP/TetO7 Reporter Is Effective in K-562 Cells but Not in B-Lymphoblastoid Cells, Related to Figure 2 (A) Left: time-course flow cytometry analysis of AAVS1GFP/TetO7 K-562 cell Clone #10 upon transfection with plasmids encoding for the indicated ETRs. Data show percentage of eGFP-negative cells (mean ± SEM; n = 3 independent transfections for each treatment condition). Right: representative dot plots of the indicated treatments at termination of the experiment. (B) Fold change in the expression levels of the indicated genes of eGFP-negative cells sorted from the double ETR transfected conditions of (A). The expression level of each gene was normalized to B2M and represented as fold change over matched AAVS1GFP/TetO7 untreated clone. Data are represented as mean ± SEM (n = 3 analyses on sorted cells from 3 independent transfections; statistical analysis by unpaired Student’s t test). (C) Generation of the LVTetO7/GFP cell lines. Representative dot plots showing transduction of K-562 cells (top), B-lymphoblastoid cells (middle) and NIH 3T3 cells (bottom) with LVTetO7/GFP and relative sorting strategies to generate LVTetO7/GFP reporter cell lines (dot plot on the right). (D) Percentage of eGFP-positive cells at day 3 after the indicated treatments (mean ± SEM; n = 3 independent treatments; statistical analysis by unpaired Student’s t test). (E) Time-course flow cytometry analysis of AAVS1GFP/TetO7 B-lymphoblastoid cells upon transfection with in vitro transcribed mRNAs encoding for the indicated ETRs. Data show percentage of eGFP-negative cells (mean ± SEM; n = 3 independent transfections for each treatment condition).
Figure S3
Figure S3
Activity of the Triple ETR Combination in Multiple Cell Types, Related to Figure 3 (A) Time-course flow cytometry analysis of LVTetO7/GFP K-562 cells upon transfection with mRNAs encoding for the indicated ETRs. Data show percentage of eGFP-negative cells (mean ± SEM; n = 3 independent transfections for each treatment condition). (B) Time-course flow cytometry analysis of AAVS1GFP/TetO7 B-lymphoblastoid cells upon transfection with mRNAs encoding for the indicated ETRs. Data show percentage of eGFP-negative cells (mean ± SEM; n = 3 independent transfections for each treatment condition). (C) Time-course flow cytometry analysis of LVTetO7/GFP NIH 3T3 cells upon transfection with mRNAs encoding for the indicated ETRs. Data show percentage of eGFP-negative cells (mean value of 2 independent transfections for each treatment condition). (D) Fold change in the expression level of DNMT3L over HPRT1 in K-562 cells (n = 3), B-lymphoblastoid cells (n = 3), HEK-293T cells (n = 3), human primary T Lymphocytes (n = 3), human induced Pluripotent Stem Cells (iPSC) (n = 7) and H9 human ES cell line (n = 1).
Figure S4
Figure S4
Transient Expression of dCas9-Based ETRs Allows Effective Silencing of the B2M Gene, Related to Figure 4 (A) Western blot analysis of K-562 cells 2 (top) or 10 (bottom) days post-transfection with plasmids encoding for the indicated HA-tagged ETRs. Blots were probed with an anti-HA tag or anti-Calnexin antibody, the latter used as loading control. The expected molecular weight (in KDa) of each protein is indicated. (B) Top: schematic of the CRISPR/Cas9-based gene targeting strategy used to insert a tdTomato transgene under the transcriptional control of the B2M promoter. Bottom: representative flow cytometry dot plots of K-562 cells transfected as indicated. Analysis at 15 days post-transfection. (C) Top: time-course flow cytometry analysis of HEK-293T cells upon transfection with plasmids encoding for the indicated dCas9-based ETRs and a pool of sgRNAs targeting the B2M gene. Data show percentage of B2M-negative cells (mean ± SEM; n = 3 independent transfections for each treatment condition). Bottom: representative dot plots of HEK-293T cells transfected or not with plasmids encoding for the triple dCas9-based ETRs and cognate B2M-sgRNAs. Analyses at 30 days post-transfection. (D) Time-course flow cytometry analysis of B2MtdTomato K-562 cells upon transfection with plasmids encoding for the indicated dCas9-based ETRs and a pool of sgRNAs targeting the B2M gene. Data show percentage of tdTomato-negative cells.
Figure S5
Figure S5
Stable Silencing of Three Human Endogenous Genes by the Triple ETRs Combination, Related to Figure 4 (A) Western blot analysis of K-562 cells 2 (left) or 6 (right) days upon transfection with plasmids encoding for the indicated V5-tagged TALE-based ETRs. Blots were probed with an anti-V5 tag or anti-Calnexin antibody, the latter used as loading control. The expected molecular weight (in KDa) of each protein is indicated. (B) Time-course flow cytometry analysis of B2MtdTomato K-562 cells upon transfection with plasmids encoding for the indicated TALE-based ETRs. Data show percentage of tdTomato-negative cells (mean ± SEM; n = 3 independent transfections for each treatment condition). (C) Representative dot plots showing the sorting strategy used to obtain B2M-negative HEK-293T cells (top right) from bulk-treated, ETR-silenced cells (middle). Unstained cells are shown (left). (D) Top: schematic of the IFNAR1 promoter/enhancer region showing the orientation of the sgRNAs (red arrows) and the CGI. Bottom: Graph showing the kinetics of IFNAR1 silencing (measured as fold change in mRNA levels over untreated cells, HPRT1 as normalizer) in K-562 cells transfected with plasmids encoding for the indicated dCas9-based ETRs and a pool of 6 sgRNAs targeting the IFNAR1 promoter/enhancer region. (E) Graph showing the kinetics of VEGFA silencing (measured as fold change in mRNA levels over untreated cells, HPRT1 as normalizer) in K-562 cells transfected with plasmids encoding for the indicated dCas9-based ETRs and a pool of 12 sgRNAs targeting the VEGFA promoter/enhancer region. (F) Representative dot plot of B2MtdTomato K-562 cells treated for multiplex gene silencing (left) and expression analysis of the indicated genes from tdTomato-negative cells (right). The expression level of the indicated genes was normalized to HPRT1 (mean ± SEM of 2 independent transfections for each treatment condition). Analysis at 25 days post-transfection. (G) Three-dimensional scatterplot depicting the expression levels of B2M, IFNAR1 and VEGFA in 21 K-562 cell clones derived from a multiplex gene silencing experiment performed with dCas9-based ETRs and a pool of sgRNAs targeting the three genes. Axes represent the fold change in mRNA levels of the indicated genes over a mean of three untreated cell populations (HPRT1 as normalizer). Clones with consistent and concurrent downregulation of the three genes are identified by squares. Grouping was performed with Density-Based Spatial Clustering of Applications with Noise (DBSCAN). Points are colored by their euclidean distance from origin of the cartesian space, this corresponding to the ideal perfect triple silencing (0,0,0). Transparency reflects distance from the observer, solid marks are the closest.
Figure S6
Figure S6
Reactivation of the B2M Gene by Targeted DNA Demethylation Is Effective Also with Individual sgRNAs and Is Amenable to Further B2M Re-silencing, Related to Figure 6 (A) Histogram showing the percentage of tdTomato-positive cells at 26 days post-transfection with plasmids encoding for a pool of 4 sgRNAs targeting the B2M promoter and either dCas9:VP160, dCas9:p300 or dCas9:Tet1 (mean ± SEM; n = 4 independent transfections for each treatment condition). Data are shown upon normalization to the percentage of tdTomato-positive cells present in untreated controls. (B) Left: histogram showing the fold change in mRNA levels of MYOD between treated and untretated cells (B2M as normalizer). Analysis was performed 5 days post-transfection of HEK-293T cells with plasmids encoding for dCas9:VP160 or dCas9:p300 and a pool of 4 sgRNAs targeting the MYOD promoter (mean ± SEM of 2 independent transfections for each treatment condition). Right: histogram showing the percentage of B2MtdTomato K-562 cells expressing the tdTomato transgene at higher MFI than untreated cells. Analysis was performed 4 days post-transfection with plasmids encoding for dCas9:VP160 or dCas9:p300 with or without a pool of 4 sgRNAs targeting the B2M promoter (mean ± SEM; n = 3 independent transfections for each treatment condition). The flow cytometry dot plots show the gating strategy used for the analysis. (C) Top: schematic showing the relative location of the sgRNAs (red arrows) selected to target dCas9:TET1 to the B2M enhancer/promoter region. Bottom: histogram showing the percentage of reactivated B2MtdTomato K-562 cells at 10 days post-transfection with plasmids encoding for the indicated sgRNAs and dCas9:TET1 (mean ± SEM of 2 independent transfections for each treatment condition). Data are shown upon normalization to the percentage of tdTomato-positive cells present in untreated controls. The flow cytometry dot plots show representative samples and the gating strategy used for the analysis. (D) Bisulfite analysis of the B2M promoter from untreated (n = 8 PCR sequencings from independent bacterial clones), silenced (n = 11 PCR sequencings from independent bacterial clones) and reactivated (n = 8 PCR sequencings from independent bacterial clones) cells. Data show percentage of methylation of the indicated CpGs. (E) Left: histogram showing the percentage of tdTomato-negative cells 19 days post-transfection with plasmids encoding for the dCas9-based triple ETR combination and for a panel of 4 sgRNAs targeting the B2M gene in the two indicated B2MtdTomato K-562 cell lines (mean ± SEM; n = 3 independent transfections for each treatment condition). Right: flow cytometry dot plots of B2MtdTomato K-562 cells treated as indicated.
Figure S7
Figure S7
Specificity Analyses of the Triple ETR Combination, Related to Figure 7 (A) Histogram showing the percentage of tdTomato-negative cells at 25 days post-transfection with plasmids encoding for the indicated TALE- and dCas9- based ETRs with or without the wild-type DNMT3L (wt.D3L). Data are shown as mean ± SEM of 3 independent transfections for each treatment condition. (B) Histogram showing the fold change in the expression levels of the indicated genes at day 7 upon transient transfection of plasmids encoding for TALE:K targeting the indicated genes. Data are represented as mean ± SEM of 3 independent transfections for each treatment condition. (C) Enrichment of DMRs (defined at low stringency cutoff: nominal p value < 0.01, logFC > 1) in repetitive elements, defined by RepeatMasker annotation from UCSC Genome Browser track. For each experiment, the ratio of selected DMRs overlapping a specific class of repetitive element was calculated. Horizontal black bars represent the ratio of all analyzable methylated regions (n = 198886) over repetitive elements. None of the ratios was found significantly higher than the expected (test: chi-square).

References

    1. Amendola M., Giustacchini A., Gentner B., Naldini L. A double-switch vector system positively regulates transgene expression by endogenous microRNA expression (miR-ON vector) Mol. Ther. 2013;21:934–946. - PMC - PubMed
    1. Bauer D.E., Kamran S.C., Lessard S., Xu J., Fujiwara Y., Lin C., Shao Z., Canver M.C., Smith E.C., Pinello L. An erythroid enhancer of BCL11A subject to genetic variation determines fetal hemoglobin level. Science. 2013;342:253–257. - PMC - PubMed
    1. Biffi A., Montini E., Lorioli L., Cesani M., Fumagalli F., Plati T., Baldoli C., Martino S., Calabria A., Canale S. Lentiviral hematopoietic stem cell gene therapy benefits metachromatic leukodystrophy. Science. 2013;341:1233158. - PubMed
    1. Boettcher M., McManus M.T. Choosing the Right Tool for the Job: RNAi, TALEN, or CRISPR. Mol. Cell. 2015;58:575–585. - PMC - PubMed
    1. Cantore A., Ranzani M., Bartholomae C.C., Volpin M., Valle P.D., Sanvito F., Sergi L.S., Gallina P., Benedicenti F., Bellinger D. Liver-directed lentiviral gene therapy in a dog model of hemophilia B. Sci. Transl. Med. 2015;7:277ra28. - PMC - PubMed

Publication types

MeSH terms

Substances