. 2016 Sep 22;167(1):233-247.e17.
doi: 10.1016/j.cell.2016.08.056.

Editing DNA Methylation in the Mammalian Genome

Affiliations

Editing DNA Methylation in the Mammalian Genome

X Shawn Liu et al. Cell. .

Abstract

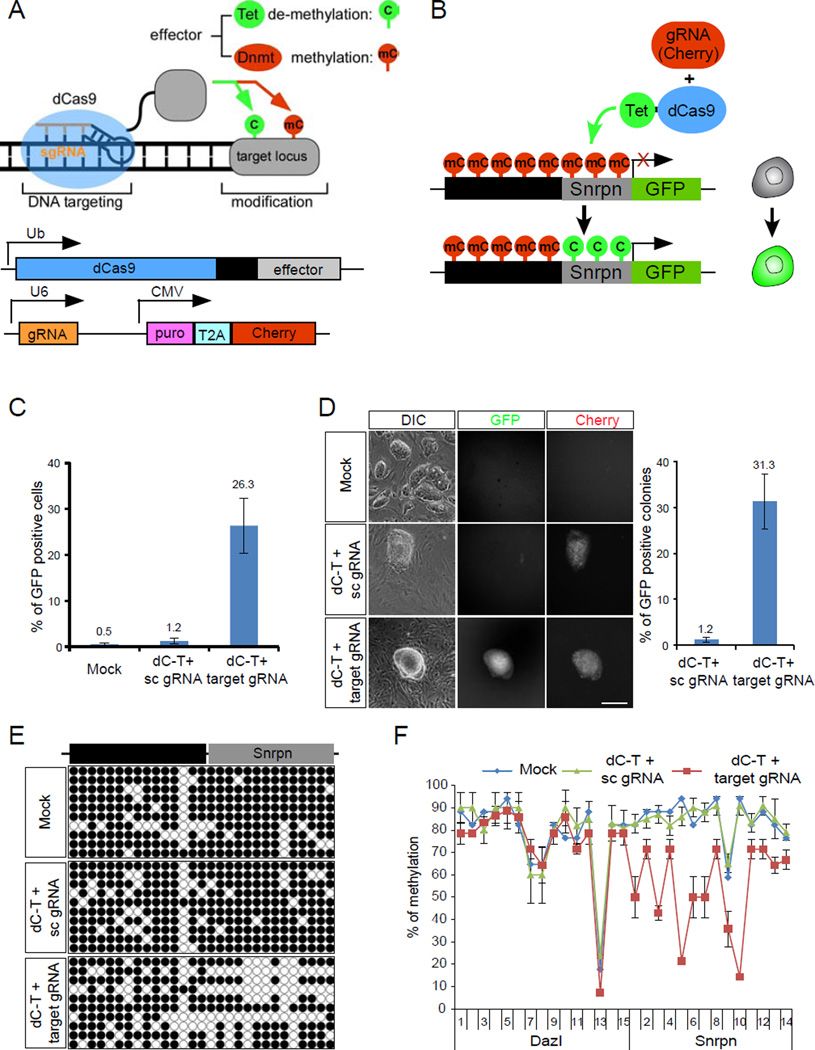
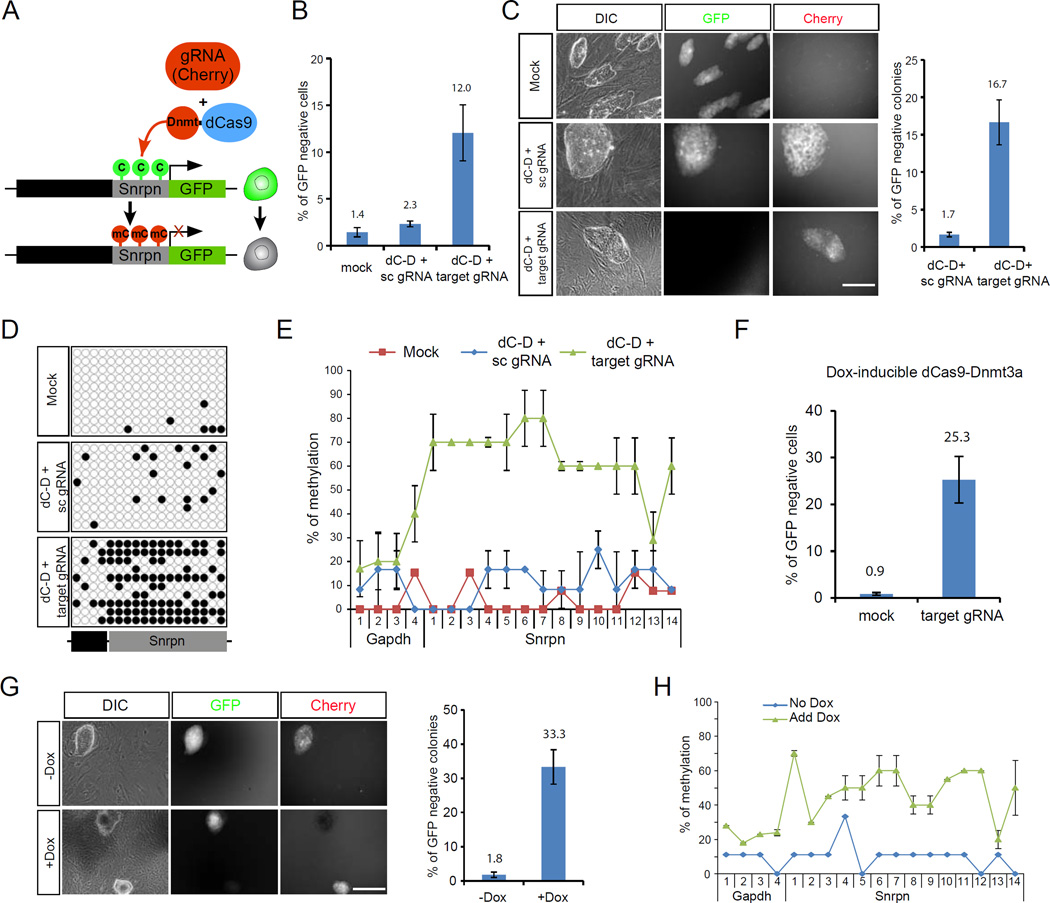
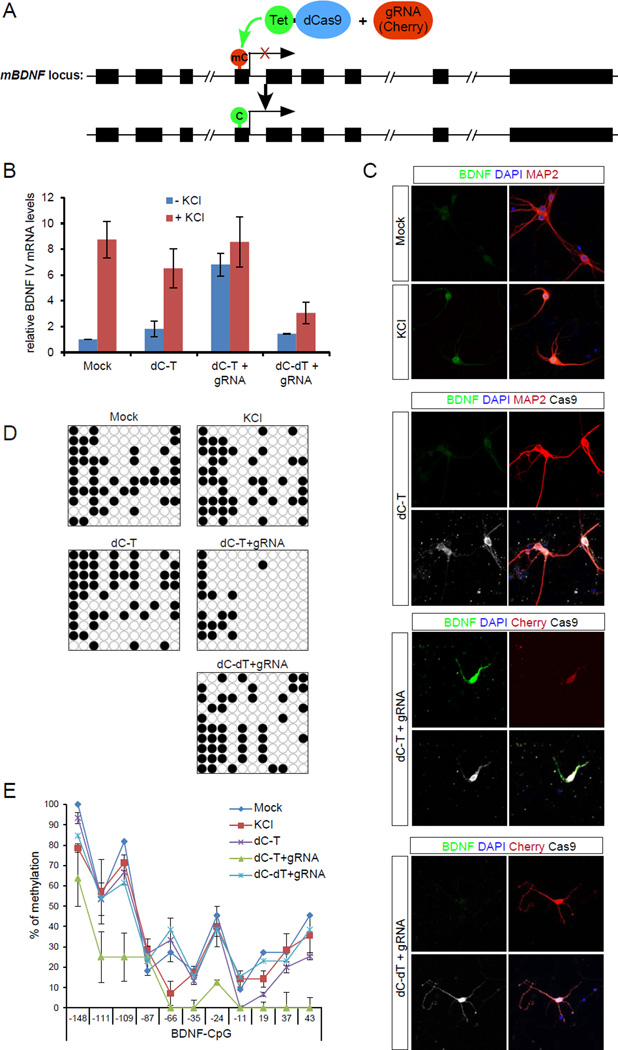
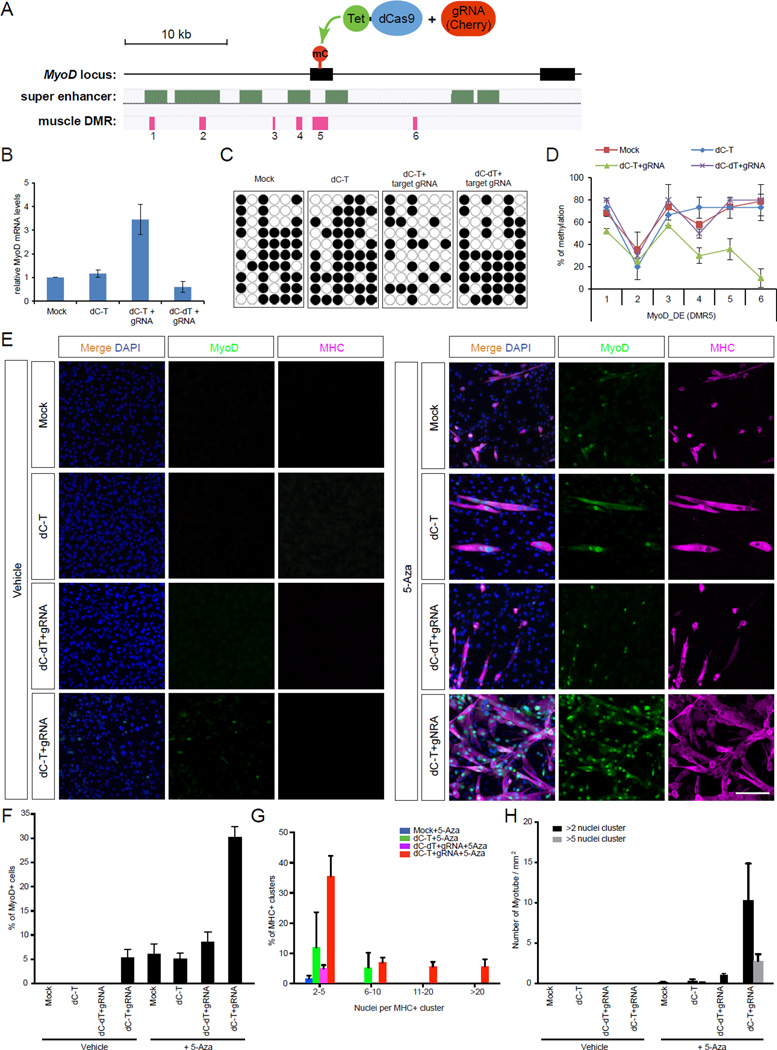
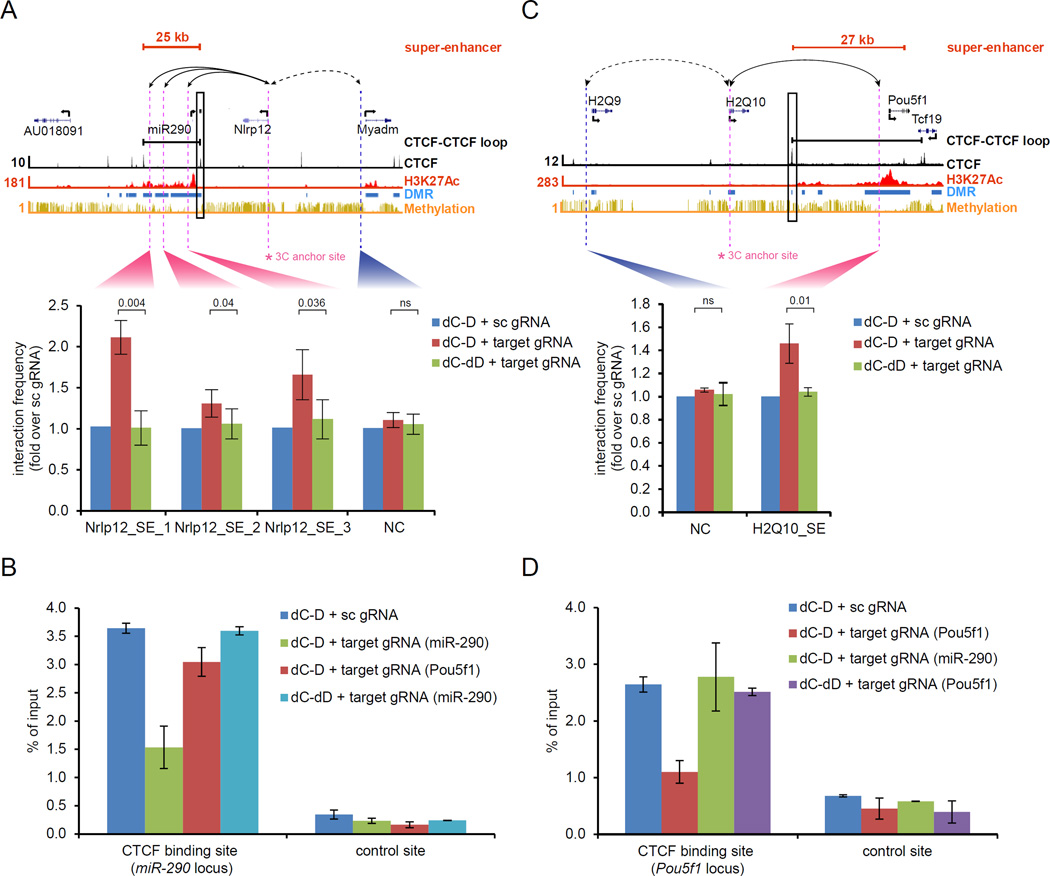
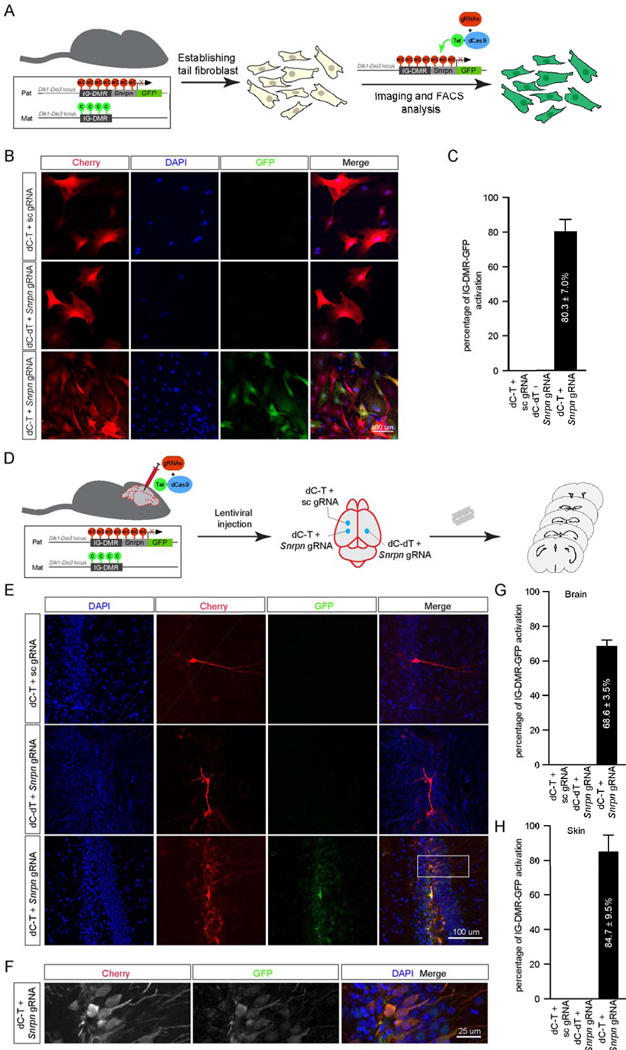
Mammalian DNA methylation is a critical epigenetic mechanism orchestrating gene expression networks in many biological processes. However, investigation of the functions of specific methylation events remains challenging. Here, we demonstrate that fusion of Tet1 or Dnmt3a with a catalytically inactive Cas9 (dCas9) enables targeted DNA methylation editing. Targeting of the dCas9-Tet1 or -Dnmt3a fusion protein to methylated or unmethylated promoter sequences caused activation or silencing, respectively, of an endogenous reporter. Targeted demethylation of the BDNF promoter IV or the MyoD distal enhancer by dCas9-Tet1 induced BDNF expression in post-mitotic neurons or activated MyoD facilitating reprogramming of fibroblasts into myoblasts, respectively. Targeted de novo methylation of a CTCF loop anchor site by dCas9-Dnmt3a blocked CTCF binding and interfered with DNA looping, causing altered gene expression in the neighboring loop. Finally, we show that these tools can edit DNA methylation in mice, demonstrating their wide utility for functional studies of epigenetic regulation.


Figures

Figure 1
Figure 1
Activation of the Dazl-Snrpn-GFP reporter by dCas9-Tet1. (A) Upper panel: schematic representation of a catalytic inactive mutant Cas9 (dCas9) fused with Tet1 for erasing DNA methylation, and with Dnmt3a for de novo methylation of specific sequences. Lower panel: an optimized dCas9-effector construct and a guide RNA construct with puro and Cherry cassettes. (B) Schematic representation of targeting the Snrpn promoter region by dCas9-Tet1 with specific gRNAs to erase methylation and activate GFP expression. (C) Dazl-Snrpn-GFP mESCs were infected with lentiviruses expressing dCas9-Tet1 (dC-T) with a scrambled gRNA (sc gRNA) or 4 gRNAs targeting the Snrpn promoter region (target gRNA). Percentage of GFP positive cells were calculated by flow cytometric analysis of these cells 3-day post infection, and shown as the mean percentages of GFP positive cells ± SD of two biological replicates. Note that the percentages of GFP-positive cells are expressed as the fraction of infected Cherry-positive cells. (D) Left, representative fluorescence images of the sorted Cherry positive cells in C after culturing for 1 week. Scale bar: 250 um. Right, percentages of GFP positive colonies were quantified, and shown as the mean percentages of GFP positive cells ± SD of two biological replicates. (E) Bisulfite sequencing of cells described in C. (F) Methylation levels of individual CpGs in the Snrpn promoter region and the adjacent Dazl locus. Shown is the mean percentage ± SD of two biological replicates. See also Figure S1 and S2.
Figure 2
Figure 2
Silencing of the Gapdh-Snrpn-GFP reporter by dCas9-Dnmt3a. (A) Schematic representation of targeting the Snrpn promoter region by dCas9-Dnmt3a with specific gRNAs to methylate the promoter and silence GFP expression. (B) Gapdh-Snrpn-GFP mESCs were infected with lentiviruses expressing dCas9-Dnmt3a (dC-D) with a scrambled gRNA (sc gRNA) or gRNAs targeting the Snrpn promoter region (target gRNA). Percentage of GFP negative cells was calculated by flow cytometric analysis 3-days after infection, and is shown as the mean percentages of GFP negative cells ± SD of two biological replicates. Note that the percentages of GFP-positive cells are expressed as the fraction of infected Cherry-positive cells. (C) Left, representative fluorescence images of the sorted Cherry-positive cells in B after culturing for 1 week. Scale bar: 250 um. Right, percentages of GFP negative colonies were quantified, and are shown as the mean percentages of GFP negative cells ± SD of two biological replicates. (D) Bisulfite sequencing of cells described in B. (E) Methylation levels of individual CpGs in the Snrpn promoter region and the adjacent Gapdh locus. Shown is the mean percentage ± SD of two biological replicates. (F) Gapdh-Snrpn-GFP mESCs with Doxycycline-inducible dCas9-Dnmt3a were infected with lentiviruses expressing gRNAs targeting the Snrpn promoter region in the presence of Doxycycline (2 ug/ml). Percentages of GFP negative cells were calculated by flow cytometric analysis 3-day after infection, and are shown as the mean percentages of GFP negative cells ± SD of two biological replicates. Note that the percentages of GFP-positive cells are expressed as the fraction of infected Cherry-positive cells. (G) Left, representative fluorescence images of the sorted Cherry-positive population in F after culturing for 1 week with or without Doxycycline. Scale bar: 250 um. Right, percentages of GFP negative colonies were quantified, and are shown as the mean percentages of GFP negative cells ± SD of two biological replicates. (H) Methylation level of each individual CpG in the Snrpn promoter region and the adjacent Gapdh locus from cells in G. Shown is the mean percentage ± SD of two biological replicates. See also Figure S2.
Figure 3
Figure 3
Targeted demethylation of BDNF promoter IV by dCas9-Tet1 to activate BDNF in neurons. (A) Schematic representation of targeting BDNF promoter IV by dCas9-Tet1 (dC-T) with specific gRNAs to erase methylation and activate BDNF expression. (B) Mouse cortical neurons cultured in vitro for 3 days (DIV3) were infected with lentiviruses expressing dC-T with or without gRNAs targeting the BDNF promoter IV, or a catalytic dead form of Tet1 (dC-dT) with BDNF gRNAs for 2 days, and then treated with or without KCl (50 mM) for 6 hours before harvesting for RT-qPCR analysis. Bars are mean ± SD of three biological replicates. (C) Representative confocal images for BDNF induction in B. Stained in red for MAP2 (top two panels) or Cherry (bottom two panels), green for BDNF, blue for DAPI and grey for dCas9. Scale bar: 50 um. (D) Bisulfite sequencing of neurons in C. (E) Methylation levels of each individual CpGs in the BDNF promoter IV region. Shown is the mean percentage ± SD of two biological replicates. See also Figure S4.
Figure 4
Figure 4
Targeted demethylation of the MyoD distal enhancer by dCas9-Tet1 to facilitate conversion of fibroblasts to myoblasts. (A) Schematic representation of targeting the MyoD distal enhancer (DE) region in DMR-5 by dCas9-Tet1 (dC-T) with specific gRNAs. (B) C3H10T1/2 cells were infected with lentiviruses expressing dC-T with target gRNAs, or a catalytic dead form of Tet1 (dC-dT) with target gRNAs for 2 days. Cherry positive cells were FACS sorted for RT-qPCR analysis. Bars represent mean ± SD of three experimental replicates. (C) Bisulfite sequencing of cells in B. (D) Methylation level of individual CpGs in the MyoD DE region. Shown is the mean percentage ± SD of two biological replicates. (E) Representative confocal images for C3H10T1/2 cells on day 14 in the fibroblast-to-myoblast conversion assay. Stained in green for MyoD, magenta for MHC and blue for DAPI. Scale bar: 200 um. (F) Quantification of MyoD positive cell ratio 14-day post infection with lentiviruses expressing dC-T alone, dC-T or dC-dT with gRNAs targeting DMR-5. (G) Distribution profile of MHC positive cell clusters based on nuclei number per MHC+ cluster (grouped as 2–5, 6–10, 11–20 and >20 nuclei per MHC+ cluster) 14-days post infection. (H) Quantification of myotube density in MHC positive clusters with more than 2 or 5 nuclei at 14-days after infection. Data are quantified from 3–5 representative images for F-H. Bars represent mean ± SD. See also Figure S5.
Figure 5
Figure 5
Targeted methylation of CTCF binding sites. (A) Schematic representation of targeting the CTCF binding site by dCas9-Dnmt3a with specific gRNAs to induce de novo methylation, blocking CTCF recruitment, and opening CTCF loops which alters gene expression in the adjacent loop. (B) Schematic representation of CTCF target-1 (miR290 locus) with super-enhancer and miR290 in the loop, AU018091 gene in the left neighboring loop, and Nlrp12 gene in the right neighboring loop (close to the targeted CTCF binding site). The Myadm gene is in the adjacent loop right to the loop containing Nlrp12. The super-enhancer domain is indicated as a red bar. The targeted CTCF site is highlighted with a box. ChIP-seq binding profiles (reads per million per base pair) for CTCF in black and H3K27Ac (super-enhancer) in red, and methylation track in yellow with DMR in blue are also shown. (C–E) Doxycycline-inducible dCas9-Dnmt3a mESCs were infected with lentiviruses expressing a scrambled gRNA or CTCF target-1 gRNAs. Cherry-positive cells were FACS sorted, cultured in the presence of Doxycycline, and then harvested for RT-qPCR analysis in C, for bisulfite-sequencing analysis in D&E. Bars represent mean ± SD of three experimental replicates. (F) Schematic representation of CTCF target-2 with super-enhancer and Pou5f1 gene in this loop as in B. (G–I) The same set of experiments were performed as described in C-E for CTCF target-2, and cells were harvested for RT-qPCR analysis as in C and for bisulfite sequencing as in D and E. Bars represent mean ± SD of three experimental replicates. See also Figure S6.
Figure 6
Figure 6
Targeted methylation of CTCF binding sites to manipulate CTCF loops. (A) Quantitative Chromosome Conformation Capture (3C) analysis of cells described in Fig 5C at the miR290 locus. The super-enhancer domain is indicated as a red bar. The targeted CTCF site is highlighted with a box. Arrows indicate the chromosomal positions between which the interaction frequency was assayed. Asterisk indicates the 3C anchor site. ChIP-seq binding profiles (reads per million base pair) for CTCF in black and H3K27Ac (super-enhancer) in red, and methylation track in yellow with DMR in blue are also shown. The interaction frequencies between the indicated chromosomal positions and the 3C anchor sites are displayed as a bar chart (mean ± SD) on the bottom panel. qPCR reactions were run in duplicates, and values are normalized against the mean interaction frequency in cells with a scrambled gRNA. (p < 0.05 for all three regions; Student’s t test, ns stands for non-significant, NC stands for negative control.) (B) Anti-CTCF ChIP experiment was performed using cells in A followed by quantitative PCR analysis. Bars represent mean ± SD of three experimental replicates. (C) Quantitative Chromosome Conformation Capture (3C) analysis of cells described in Fig 5G at the Pou5f1 locus as in A. (D) Anti-CTCF ChIP experiment was performed using cells in C followed by quantitative PCR analysis. Bars represent mean ± SD of three experimental replicates.
Figure 7
Figure 7
Targeted ex vivo and in vivo DNA methylation editing by dCas9-Tet1 to activate a silenced GFP reporter. (A) Schematic diagram illustrating the experimental procedure for the ex vivo activation of a silenced GFP reporter in mouse fibroblast cells. Mouse tail fibroblast cells were derived from a genetically modified mouse line carrying a paternal IG-DMR-Snrpn-GFP allele (IG-DMRGFP/Pat) in the Dlk1-Dio3 locus. The IG-DMR-Snrpn promoter on the paternal allele is hypermethylated so that the GFP reporter is constitutively silenced. The cultured fibroblast cells were infected with lentiviral vectors expressing dCas9-Tet1 and gRNAs to demethylate the Snrpn promoter and activate the GFP reporter. (B) Representative immunohistochemical images of IG-DMRGFP/Pat fibroblasts infected with lentiviruses expressing dCas9-Tet1 (dC-T) with a sc gRNA, an inactive form of dCas9-Tet1 (dC-dT) with Snrpn target gRNA, or dCas9-Tet1 with Snrpn target gRNA. Stained in red for Cherry, green for GFP and DAPI for nuclei. Scale bar: 100 um. (C) Quantification of the percentage of IG-DMRGFP/Pat mouse fibroblast cells with GFP activation in Cherry (gRNAs) positive cells. Bars represent mean ± SD of three experimental replicates. (D) Schematic diagram illustrating the experimental procedure for in vivo activation of GFP reporter in the IG-DMRGFP/Pat mouse brain. Lentiviral vectors expressing dC-T and sc gRNA, dC-dT and Snrpn target gRNAs, and dC-T and Snrpn target gRNAs were delivered with stereotaxic microinjection approach. Brains were sliced and analyzed by immunohistochemical approaches. (E) Representative confocal micrographs for the IG-DMRGFP/Pat mouse brains infected with dC-T and sc gRNA, dC-dT and Snrpn target gRNAs, and dC-T and Snrpn target gRNAs. Only dC-T with the target gRNAs activated the GFP expression. Scale bar: 100 um. (F) Confocal micrograph of the boxed area in E. Stained in red for Cherry, green for GFP and DAPI for nuclei in E and F. Scale bar: 25 um. (G–H) Quantification of the percentage of IG-DMRGFP/Pat cells with GFP activation in Cherry (gRNAs) positive cells in the in vivo lentiviral delivery experiment in the brain (G) and in the skin epidemis (H). Bars represent mean ± SD of more than four representative images from 2 animals. See also Figure S7.

References

    1. Bell AC, Felsenfeld G. Methylation of a CTCF-dependent boundary controls imprinted expression of the Igf2 gene. Nature. 2000;405:482–485. - PubMed
    1. Bernstein DL, Le Lay JE, Ruano EG, Kaestner KH. TALE-mediated epigenetic suppression of CDKN2A increases replication in human fibroblasts. J Clin Invest. 2015;125:1998–2006. - PMC - PubMed
    1. Bird A. DNA methylation patterns and epigenetic memory. Genes Dev. 2002;16:6–21. - PubMed
    1. Brunk BP, Goldhamer DJ, Emerson CP., Jr Regulated demethylation of the myoD distal enhancer during skeletal myogenesis. Dev Biol. 1996;177:490–503. - PubMed
    1. Chen B, Gilbert LA, Cimini BA, Schnitzbauer J, Zhang W, Li GW, Park J, Blackburn EH, Weissman JS, Qi LS, et al. Dynamic imaging of genomic loci in living human cells by an optimized CRISPR/Cas system. Cell. 2013;155:1479–1491. - PMC - PubMed

Publication types

MeSH terms