. 2016 Sep 23;12(9):e1005112.
doi: 10.1371/journal.pcbi.1005112. eCollection 2016 Sep.

Cytofkit: A Bioconductor Package for an Integrated Mass Cytometry Data Analysis Pipeline

Affiliations

Cytofkit: A Bioconductor Package for an Integrated Mass Cytometry Data Analysis Pipeline

Hao Chen et al. PLoS Comput Biol. .

Abstract

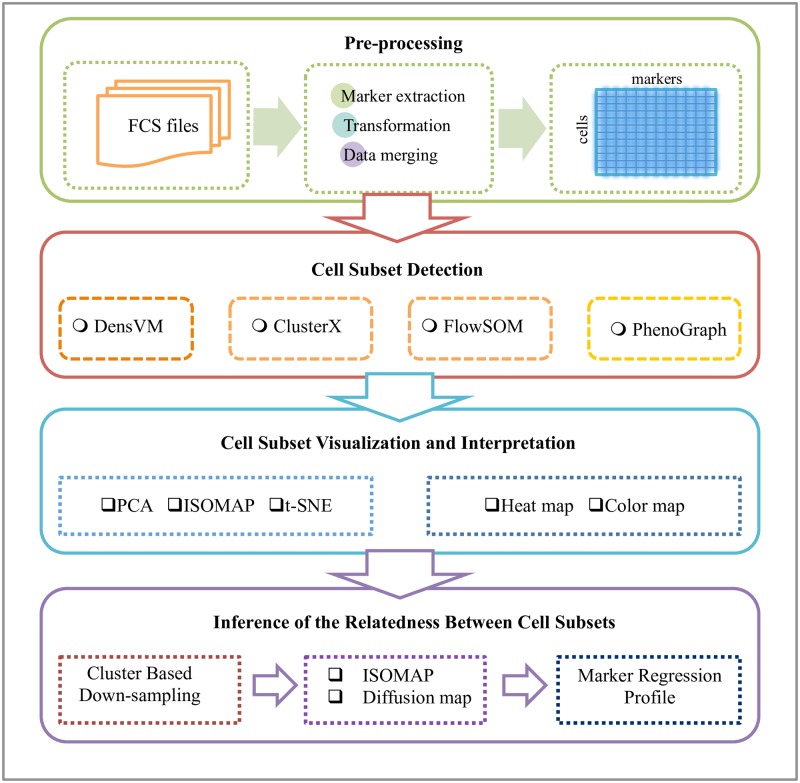
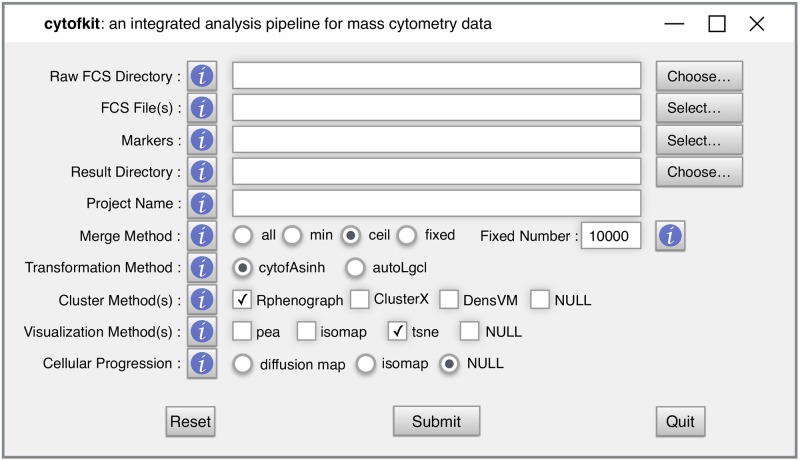
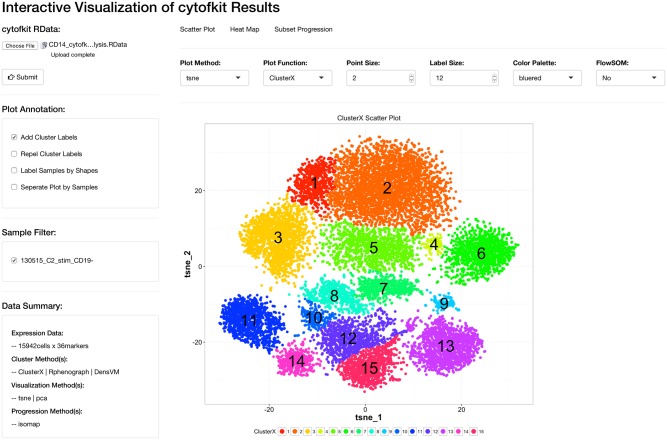
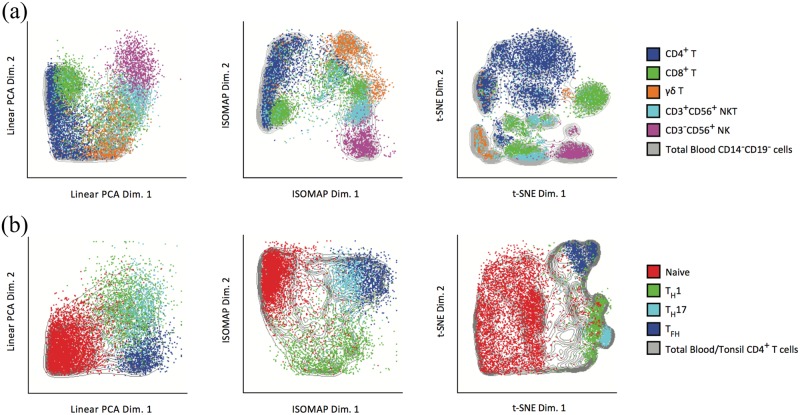
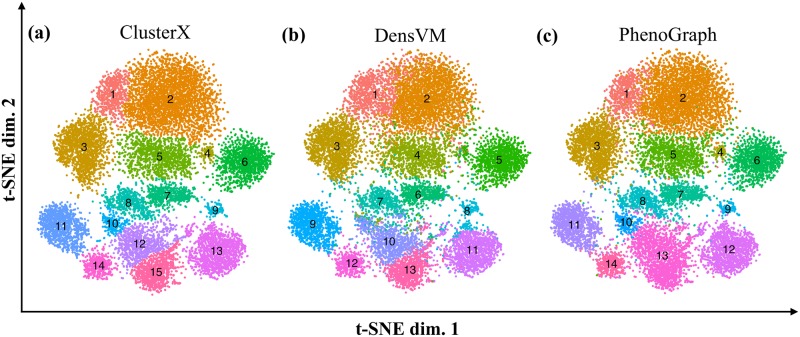
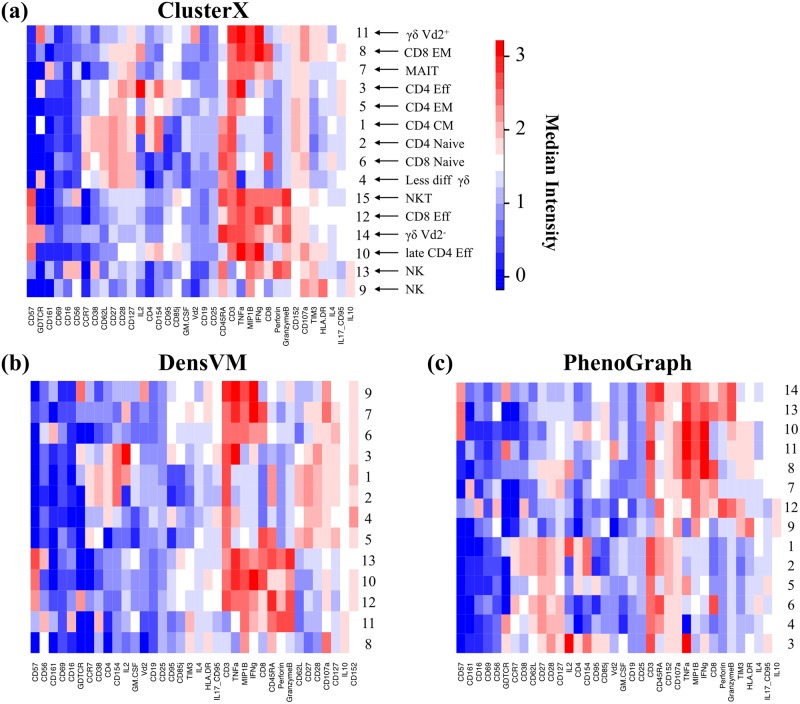
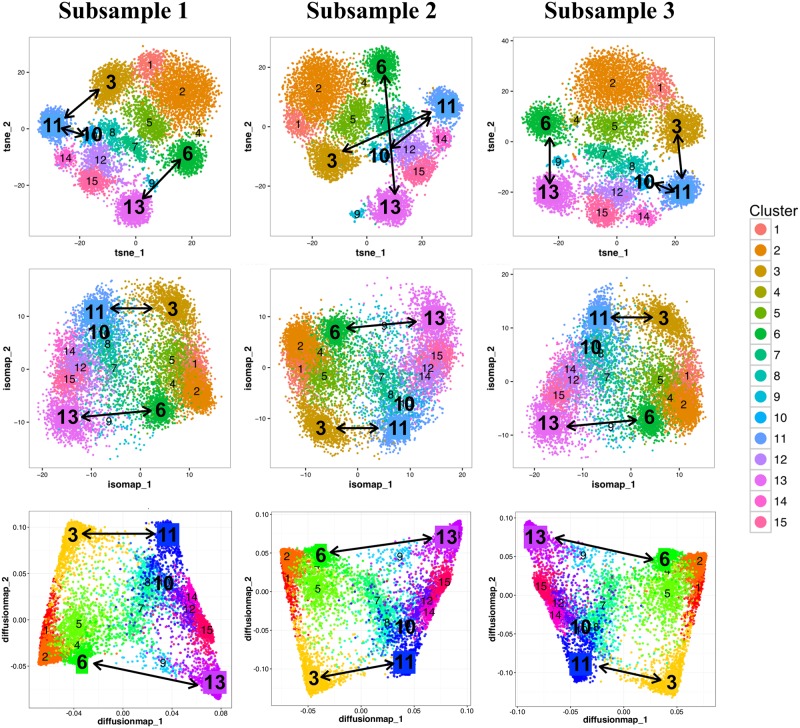
Single-cell mass cytometry significantly increases the dimensionality of cytometry analysis as compared to fluorescence flow cytometry, providing unprecedented resolution of cellular diversity in tissues. However, analysis and interpretation of these high-dimensional data poses a significant technical challenge. Here, we present cytofkit, a new Bioconductor package, which integrates both state-of-the-art bioinformatics methods and in-house novel algorithms to offer a comprehensive toolset for mass cytometry data analysis. Cytofkit provides functions for data pre-processing, data visualization through linear or non-linear dimensionality reduction, automatic identification of cell subsets, and inference of the relatedness between cell subsets. This pipeline also provides a graphical user interface (GUI) for ease of use, as well as a shiny application (APP) for interactive visualization of cell subpopulations and progression profiles of key markers. Applied to a CD14-CD19- PBMCs dataset, cytofkit accurately identified different subsets of lymphocytes; applied to a human CD4+ T cell dataset, cytofkit uncovered multiple subtypes of TFH cells spanning blood and tonsils. Cytofkit is implemented in R, licensed under the Artistic license 2.0, and freely available from the Bioconductor website, https://bioconductor.org/packages/cytofkit/. Cytofkit is also applicable for flow cytometry data analysis.


Conflict of interest statement

The authors have declared that no competing interests exist.

Figures

Fig 1
Fig 1. Schematic view of cytofkit pipeline.
The cytofkit pipeline consists of four major components: (1) pre-processing, (2) cell subset detection, (3) cell subset visualization and interpretation and (4) inference of the relatedness between cell subsets.
Fig 2
Fig 2. Workflow of ClusterX for mass cytometry data clustering.
(a) depict the workflow of ClusterX for mass cytometry data clustering, which contains four steps: (i) t-SNE dimensionality reduction (ii) estimate the local density on the t-SNE map (iii) detect the density peaks represented as cluster centers and (iv) assign the remaining cells to clusters. (b) Explains the local density estimation method. (c) Illustrate the cluster assigning step using two peaks, peak1 and peak 2. Each point is a cell and the color intensity represents the local density of the cell. Then each cell is assigned to be the same cluster as its nearest neighbor cell which has higher density than it.
Fig 3
Fig 3. The appearance of the GUI for cytofkit.
The GUI provides full options of cytofkit with help buttons explaining the meaning of each parameter.
Fig 4
Fig 4. The appearance of the shiny APP for cytofkit.
The shiny APP is designed to provide interactively visualization and exploration the cytofkit analysis results. It is integrated into cytofkit package and also a stand-alone online application.
Fig 5
Fig 5. Comparison of dimensionality reduction methods.
PCA, ISOMAP and t-SNE are performed on the CD14CD19 PBMCs dataset and the CD4+ T cell dataset, respectively. In each panel, Cells are plotted using the first two dimensions of the dimensionality-transformed data and color coded by gated populations. (a) Plot of manually gated CD4+, CD8+, γδT, CD3+CD56+ NKT and CD3CD56+ NK cell populations from the CD14CD19 PBMCs dataset using PCA, ISOMAP, and t-SNE. (b) Plot of manually gated naïve (CD45RA+CCR7+CD45RO-), TH1 (IFN-γ+), TH17 (IL-17A+) and TFH (CXCR5hiPD-1hi) cell populations from the CD4+ T cell dataset using PCA, ISOMAP, and t-SNE.
Fig 6
Fig 6. Comparison of clustering methods.
Each panel represents one clustering results mapped on the t-SNE plot; from left to right they are (a) ClusterX, (b) DensVM and (c) PhenoGraph. Clusters were annotated by different colors and with cluster ID at the center of the cluster.
Fig 7
Fig 7. Clusters annotation with heat map.
Heat maps show median marker expression of clusters detected by (a) ClusterX, (b) DensVM and (c) PhenoGraph respectively. Heat map row labels represent the cluster IDs and column labels show the marker names. Clusters are annotated by its expression profile in (a).
Fig 8
Fig 8. Assessing ISOMAP, diffusion map and t-SNE for inference of subset relationship.
Three subsamples are down-sampled from the CD14CD19 PBMCs dataset with equal cell number of 10000. From top to bottom row, the relationship of Cluster X clusters is visualized by t-SNE, ISOMAP and diffusion map on each of the subsample. Cells are color-coded by ClusterX clusters, and cluster IDs are added at the center of each cluster.
Fig 9
Fig 9
(a) ISOMAP and diffusion map plots of the down-sampled subsets. Cells are color-coded by ClusterX clusters. Cluster IDs are labeled at the center of each cluster (b) Plots of the expression level of marker Perforin using ISOMAP and diffusion map. Estimated progression among annotated subsets γδ Vd+, γδ Vd, CD8 Eff, NKT and NK are added on the plots. (c) The expression profiles of marker Perforin and GranzymeB for cluster 11, 12, 13, 14 and 15 are visualized on the second component of ISOMAP and diffusion map (reversed order). The regression line estimated using the generalized linear model (GLM) is added for each marker.

References

    1. Bandura DR, Baranov VI, Ornatsky OI, Antonov A, Kinach R, Lou X, et al. Mass cytometry: Technique for real time single cell multitarget immunoassay based on inductively coupled plasma time-of-flight mass spectrometry. Anal Chem. 2009;81: 6813–6822. 10.1021/ac901049w - DOI - PubMed
    1. Ornatsky O, Bandura D, Baranov V, Nitz M, Winnik MA, Tanner S. Highly multiparametric analysis by mass cytometry. J Immunol Methods. 2010;361: 1–20. 10.1016/j.jim.2010.07.002 - DOI - PubMed
    1. Bendall SC, Nolan GP, Roederer M, Chattopadhyay PK. A deep profiler’s guide to cytometry. Trends Immunol. Elsevier Ltd; 2012;33: 323–332. 10.1016/j.it.2012.02.010 - DOI - PMC - PubMed
    1. Newell EW, Davis MM, Bendall SC, Nolan GP, Roederer M, Chattopadhyay PK, et al. Beyond model antigens: high-dimensional methods for the analysis of antigen-specific T cells. Nat Biotechnol. Nature Publishing Group; 2014;32: 149–57. 10.1038/nbt.2783 - DOI - PMC - PubMed
    1. Amir ED, Davis KL, Tadmor MD, Simonds EF, Levine JH, Bendall SC, et al. viSNE enables visualization of high dimensional single-cell data and reveals phenotypic heterogeneity of leukemia. Nat Biotechnol. Nature Publishing Group; 2013;31: 545–52. 10.1038/nbt.2594 - DOI - PMC - PubMed