. 2016 Sep 23;12(9):e1005851.
doi: 10.1371/journal.ppat.1005851. eCollection 2016 Sep.

Carbohydrate-Binding Non-Peptidic Pradimicins for the Treatment of Acute Sleeping Sickness in Murine Models

Affiliations

Carbohydrate-Binding Non-Peptidic Pradimicins for the Treatment of Acute Sleeping Sickness in Murine Models

Víctor M Castillo-Acosta et al. PLoS Pathog. .

Abstract

Current treatments available for African sleeping sickness or human African trypanosomiasis (HAT) are limited, with poor efficacy and unacceptable safety profiles. Here, we report a new approach to address treatment of this disease based on the use of compounds that bind to parasite surface glycans leading to rapid killing of trypanosomes. Pradimicin and its derivatives are non-peptidic carbohydrate-binding agents that adhere to the carbohydrate moiety of the parasite surface glycoproteins inducing parasite lysis in vitro. Notably, pradimicin S has good pharmaceutical properties and enables cure of an acute form of the disease in mice. By inducing resistance in vitro we have established that the composition of the sugars attached to the variant surface glycoproteins are critical to the mode of action of pradimicins and play an important role in infectivity. The compounds identified represent a novel approach to develop drugs to treat HAT.


Conflict of interest statement

The authors have declared that no competing interests exist.

Figures
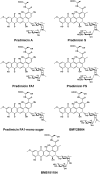
Fig 1
Fig 1. Structural formulae of the pradimicins.
Fig 2
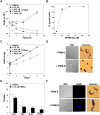
Fig 2. Effect of PRM-S treatment on in vitro T. brucei BSFs.
(A) Plot showing the number of parasites in culture exposed to increasing concentrations of PRM-S (5.3, 26.3, 53.0 and 106.0 μM that correspond to 1-, 5-, 10- and 20-fold the EC50, respectively). (B) Plot of the percentage of lysed parasites after PRM-S treatment for 8 h. (C) Accumulated growth after drug removal of parasites treated with PRM-S for 8 h. (D) Microscopy images of cultured samples after exposure to PRM-S for 1 h. Cells were stained with DAPI and Giemsa and observed by fluorescence and light microscopy. (E) Nuclei (N) and kinetoplasts (K) of parasites treated with 5.3 μM for 48 h were stained with DAPI and categorized according to the number of nuclei and kinetoplasts: 1N1K, 1N2K, 2N2K and XNXK. (F) Microscopy images illustrating DIC, DAPI and Giemsa staining of cells exposed to 5.3 μM PRM-S for 48 h. The asterisk shows significant differences calculated by the Student’s t-test (n = 2). *, p < 0.05. Bars, 10 μm.
Fig 3
Fig 3. PRM-S binding and fluid-phase endocytosis analysis.
PRM-S binding to parasite surface VSGs was evaluated by competition labelling assays using HHA, a lectin that binds to VSGs and is rapidly endocytosed [5] or CV-N, a lectin that binds to the surface coat of the trypanosomes. Labelling was measured by FACS at 0 min, 10 min and 60 min of incubation at increasing PRM-S concentrations and visualized by 3D microscopy. (A and B) Quantification (A) and images (B) of the labelling with HHA-FITC (1 μg/ml) in the presence of PRM-S. (C and D) Fluid-phase endocytosis analysis using Alexa Fluor 488-labelled dextran 10,000 in the absence (C) or in the presence (D) of HHA (1 μg/ml). (E and F) Quantification (E) and images (F) of the labelling with CV-N-FITC (0.6 μg/ml) in the presence of PRM-S. Bars, 10 μm. The asterisks show significant differences calculated by the Student’s t-test (n = 3). *, p < 0.05, **, p < 0.005 and ***, p < 0.0005 vs the parental strain.
Fig 4
Fig 4. Analysis of the nature and N-glycosylation status of the VSG expressed in PRM-A-resistant trypanosomes.
(A) Indirect immunofluorescence microscopy analysis of VSG221 expression in parasites resistant to PRM-A probed with a polyclonal antibody against VSG221. Nuclear and kinetoplast DNA was stained with DAPI. Bars, 10 μm. (B) sVSGs of parental and resistant strains were purified as described [20] and analysed by SDS/PAGE and Coomassie blue staining. (C) Western-blot analysis of sVSG isolated from parental and PRM-A100 cells using an anti-TbVSG221 polyclonal antibody. (D) Endoglycosidase treatment of sVSG samples with Endo H (that removes oligomannose N-linked glycans) or PNGase F (that removes all N-linked glycans), followed by SDS/PAGE and Coomassie blue staining analysis.
Fig 5
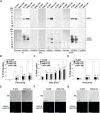
Fig 5. Assessment of the VSG glycosylation status by lectin blotting and labelling with lectins.
(A) sVSG and cell pellets lysates obtained after hypotonic lysis from parental and PRM-A100 lines were subjected to SDS-PAGE, transferred to a nitrocellulose membrane and probed with TL, ECL and ConA lectins. Ponceau staining was used as loading control. Addition of chitin hydrolysate (inhibitor), D-lactose and α-methyl mannose was used as a specificity control for TL, ECL or ConA, respectively. (B-G) Live cells of parental and PRM-A100 lines were labelled with CV-N-FITC (B and E), HHA-FITC (C and F) or UDA-FITC (D and G) conjugates and fluorescence was quantified by FACS analysis and visualized by 3D microscopy. Bars, 10 μm. The asterisks show significant differences calculated by the Student’s t-test (n = 3). *, p < 0.05, **, p < 0.01 and ***, p < 0.005 vs the parental strain.
Fig 6
Fig 6. Analysis of N-glycans from PRM-A100-resistant sVSG221.
Integrated UPLC-FLD chromatograms of procainamide labelled glycans from resistant (PRM-A100) and control (Tb BSF) N-glycan samples labelled with procainamide.
Fig 7
Fig 7. Surface plasmon resonance analysis.
(A, B and C) SPR analysis of serial dilutions of PRM-A from 1.56 to 50 μM exposed to the parental Tb BSF VSG221 bound at low density (826 RU) (A) or high density (6,500 RU) (B) and to the PRM-A100-resistant cell line VSG221 bound at high density (6,070 RU) (C) on a CM5 sensor chip. (D, E and F) SPR analysis of serial dilutions of PRM-S using the same conditions as described above.
Fig 8
Fig 8. Relative expression of TbSTT3 genes in PRM-A-resistant trypanosomes.
The mRNA levels of the STT3 genes in the PRM-A100 cell line cultured in the presence or absence of PRM-A and those of the parental line were determined by RT-qPCR and normalized with regard to the expression of the myosin 1B. Values were calculated from triplicates of three independent experiments. The asterisks show significant differences calculated by the Student’s t-test (n = 3). *, p < 0.005, **, p < 0.001 and ***, p < 0.0001 vs the parental strain.
Fig 9
Fig 9. Survival analysis of mice infected with PRM-A-resistant trypanosomes.
Kaplan-Meier survival analysis of mice infected with parental (Tb BSF) and PRM-A25, PRM-A50 and PRM-A100-resistant parasites.
Fig 10
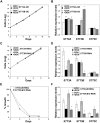
Fig 10. Effect of overexpression or RNAi mediated depletion of STT3A, STT3B and STT3C on resistance to PRM-S.
(A and B) Accumulated growth (A) and mRNA levels (B) of PRM-A100 cells overexpressing TbSTT3A or TbSTT3B. (C and D) Accumulated growth (C) and mRNA levels (D) of STT3A-RNAi and STT3B-RNAi parental cells. (E and F) Growth profile (E) and mRNA levels (F) of STT3A/B-RNAi and STT3A/B/C-RNAi parental cells. -DOX, non-induced; +DOX, cells exposed to doxycycline (1 μg/ml). Relative expression of the STT3 mRNA levels was determined by RT-qPCR and normalized with regard to the expression of myosin 1B. Values were calculated from triplicates of two independent experiments. The asterisks show significant differences between induced versus corresponding non-induced cell lines calculated by the Student’s t-test (n = 2): *, p < 0.05 and **, p < 0.001.
Fig 11
Fig 11. Endocytosis analysis.
PRM-A100 cells grown both in the presence and absence of PRM-A were used to evaluate receptor-mediated, receptor independent and fluid-phase endocytosis. The uptake of ConA (A), transferrin (B) as well as Alexa Fluor 594-dextran 10,000 (C) conjugates were measured and compared with uptake in the parental line. The asterisks show significant differences calculated by the Student’s t-test (n = 3). *, p < 0.05, **, p < 0.01 and ***, p < 0.005 vs the parental strain.
Fig 12
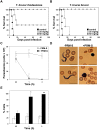
Fig 12. Treatment of T. brucei- infected mice with PRM-S.
(A and B) Kaplan-Meier survival analysis of mice infected with T. brucei rhodesiense EATRO3 ETat1.2 TREU164 (A) or with T. brucei brucei single-marker strain 427 (B) and treated with 25 mg/kg, and 50 mg/kg of PRM-S as well as with the vehicle used as control. (C) Parasitaemia course of mice infected with T. brucei brucei single-marker strain 427 at short periods after PRM-S administration (50 mg/kg). (D) Light microscopy of cells stained with Giemsa from mice infected with T. brucei brucei at 1 h after PRM-S administration. (E) Quantification of the percentage of cells exhibiting a rounded shape, which was observed by Giemsa staining. The asterisk shows significant differences calculated by the Student’s t-test (n = 2). *, p < 0.05, and **, p < 0.005. Bars, 10 μm.

Similar articles

Cited by

References

    1. Blum ML, Down JA, Gurnett AM, Carrington M, Turner MJ, Wiley DC. A structural motif in the variant surface glycoproteins of Trypanosoma brucei . Nature. 1993;362(6421):603–9. Epub 1993/04/15. 10.1038/362603a0 . - DOI - PubMed
    1. Bangs JD, Doering TL, Englund PT, Hart GW. Biosynthesis of a variant surface glycoprotein of Trypanosoma brucei. Processing of the glycolipid membrane anchor and N-linked oligosaccharides. J Biol Chem. 1988;263(33):17697–705. Epub 1988/11/25. . - PubMed
    1. Zamze SE, Wooten EW, Ashford DA, Ferguson MA, Dwek RA, Rademacher TW. Characterisation of the asparagine-linked oligosaccharides from Trypanosoma brucei type-I variant surface glycoproteins. Eur J Biochem. 1990;187(3):657–63. Epub 1990/02/14. . - PubMed
    1. Zitzmann N, Mehlert A, Carrouee S, Rudd PM, Ferguson MA. Protein structure controls the processing of the N-linked oligosaccharides and glycosylphosphatidylinositol glycans of variant surface glycoproteins expressed in bloodstream form Trypanosoma brucei . Glycobiology. 2000;10(3):243–9. Epub 2000/03/08. cwd030 [pii]. . - PubMed
    1. Castillo-Acosta VM, Vidal AE, Ruiz-Perez LM, Van Damme EJ, Igarashi Y, Balzarini J, et al. Carbohydrate-binding agents act as potent trypanocidals that elicit modifications in VSG glycosylation and reduced virulence in Trypanosoma brucei . Mol Microbiol. 2013. Epub 2013/08/10. 10.1111/mmi.12359 . - DOI - PubMed