. 2016 Sep 23;13(1):85.
doi: 10.1186/s12984-016-0194-x.

Quantifying dimensions of physical behavior in chronic pain conditions

Affiliations

Quantifying dimensions of physical behavior in chronic pain conditions

Anisoara Paraschiv-Ionescu et al. J Neuroeng Rehabil. .

Abstract

Background: Chronic pain, defined as persistent or recurrent pain lasting longer than 3 months, is a frequent condition affecting an important percent of population worldwide. Pain chronicity can be caused by many different factors and is a frequent component of many neurological disorders. An important aspect for clinical assessment and design of effective treatment and/or rehabilitation strategies is to better understand the impact of pain on domains of functioning in everyday life. The aim of this study was to identify the objectively quantifiable features of physical functioning in daily life and to evaluate their effectiveness to differentiate behavior among subjects with different pain conditions.

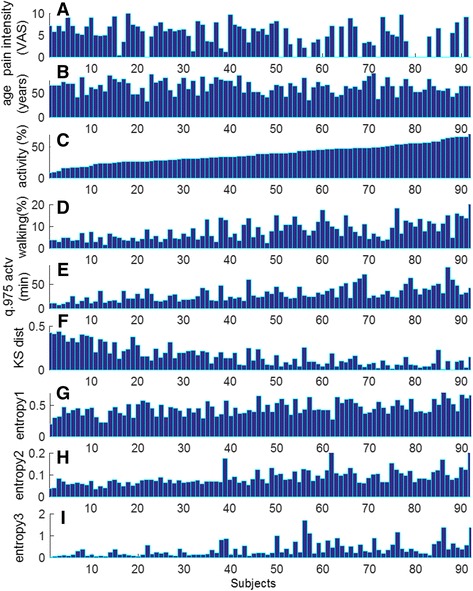
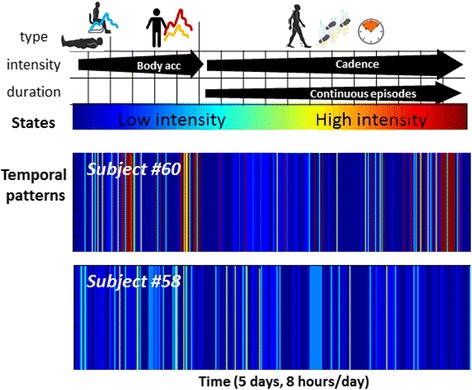
Method: Body worn sensors were used to record movement data during five consecutive days in 92 subjects. Sensor data were processed to characterize the physical behavior in terms of type, intensity, duration and temporal pattern of activities, postures and movements performed by subjects in daily life. Metrics quantifying these features were subsequently used to devise composite scores using a factor analysis approach. The severity of clinical condition was assessed using a rating of usual pain intensity on a 10-cm visual analog scale. The relationship between pain intensity and the estimated metrics/composite scores was assessed using multiple regression and discriminant analysis.

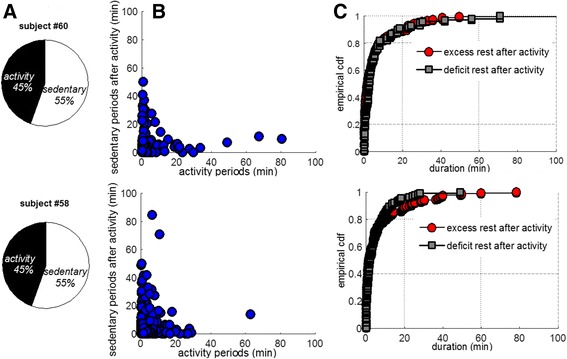
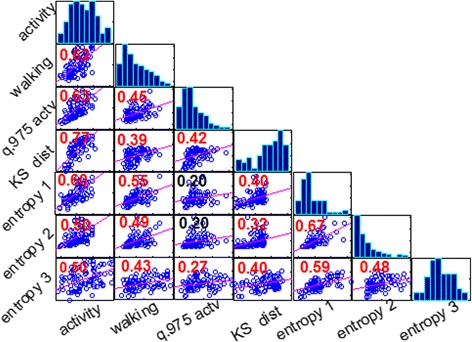
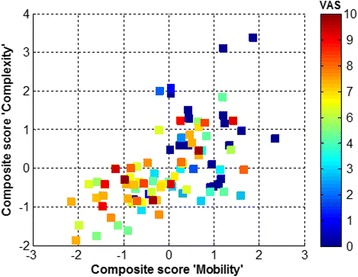
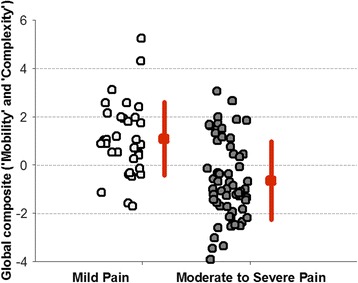
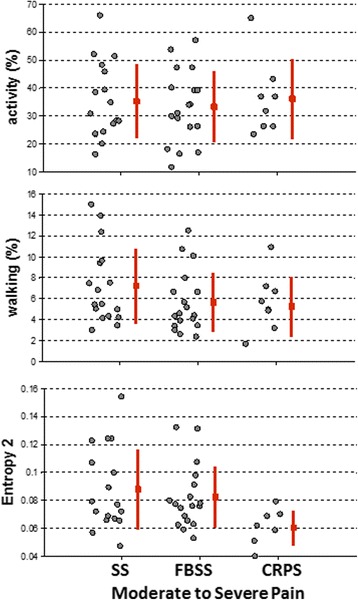
Results: According to the factor analysis solution, two composite scores were identified, one integrating the metrics quantifying the amount and duration of activity periods, and the other the metrics quantifying complexity of temporal patterns, i.e., the diversity of body movements and activities, and the manner in which they are organized throughout time. All estimated metrics and composite scores were significantly different between groups of subjects with clinically different pain levels. Moreover, analysis revealed that pain intensity seemed to have a more significant impact on the overall physical behavior, as it was quantified by a global composite score, whereas the type of chronic pain appeared to influence mostly the complexity of the temporal pattern.

Conclusion: The methodology described could be informative for the design of objective outcome measures in chronic pain management/rehabilitation programs.

Keywords: Chronic pain assessment; Composite scores; Factor analysis; Pattern complexity; Physical behavior.


Figures

Fig. 1
Fig. 1
Pain intensity (a), age (b) and PA metrics (c-i) estimated for each subject (N = 92). This representation highlights variability of physical behaviors in every-day life, and how a similar amount of activity, expressed as percentage over monitoring time (c), is accumulated from patterns characterized by different amount of walking (d), different duration of activity periods (e), different duration of sedentary periods following activity (f) and different complexity of temporal patterns (g, h, i)
Fig. 2
Fig. 2
Comparative illustration of metrics quantifying aspects of physical behavior in two subjects with different pain condition (matched by age): although the total time spent in activity/sedentary was similar (a), differences were noticed in the duration of respective periods (b), as well as in the duration of sedentary time after activity (c)
Fig. 3
Fig. 3
Definition and visualization of temporal patterns: the information about type, intensity and duration is integrated into several states (here a number of 18). Low intensity states (‘cold’ colors) are associated with sedentary postures whereas higher intensity states (‘warm’ colors) integrate the standing posture with various body accelerations (e.g. daily tasks, exercises) and walking periods characterized by various durations and cadences [29]. Visualization of these patterns provides an overview of the subject’s physical behavior during the monitoring period
Fig. 4
Fig. 4
Matrix of plots showing correlations among pairs of metrics estimated for each subject (N = 92): histograms of metrics appear along the matrix diagonal and pairwise relationships between metrics (scatter plots) appear off diagonal. The slopes of least-squares reference lines in the scatter plots are equal to the displayed correlation coefficients (red color number if statistically significant)
Fig. 5
Fig. 5
Scatter plot of composite scores, labelled Mobility and Complexity, for the ensemble of subjects; the color bar encodes subjects’ pain intensity, from 0 (in blue), to maximum value of 10 (in red). This representation indicates that: (1) there is a positive relationship between the two scores (correlation coefficient r = 0.58, p < 0.0001); (2) a number of 39 subjects with high pain intensity (VAS = 6.2 ± 2) have negative values for both scores (bottom left quadrant), i.e., values under the mean value of the entire sample of 92 subjects
Fig. 6
Fig. 6
Values of the global composite score for groups of subjects with clinically different pain intensity. The graph shows the group mean and standart deviation as well as values corresponding to each subject. Estimation of the effect size (Cohen’s d) indicates approximativelly 60 % nonoverlap between groups
Fig. 7
Fig. 7
Variation of metrics between groups of subjects with chronic pain caused by spinal stenosis (SS), failed back surgery syndrome (FBSS) and complex regional pain syndrome (CRPS). Lower entropy values for CRPS patients indicate a reduced diversity of body movements/activities, low movement intensity and long sedentary periods, suggesting the potential of this metric to capture clinically recognized motor-impairements

References

    1. Jackson TP, Stabile VS, McQueen KK. The global burden of chronic pain. ASA Newsl. 2014;78(6):24–27.
    1. Borsook D. Neurological diseases and pain. Brain. 2012;135(2):320–344. doi: 10.1093/brain/awr271. - DOI - PMC - PubMed
    1. Merskey HE. Classification of chronic pain: Descriptions of chronic pain syndromes and definitions of pain terms. Pain. 1986;Suppl 3:226. - PubMed
    1. Dworkin RH, Turk DC, Farrar JT, Haythornthwaite JA, Jensen MP, Katz NP, Kerns RD, Stucki G, Allen RR, Bellamy N, et al. Core outcome measures for chronic pain clinical trials: IMMPACT recommendations. Pain. 2005;113(1–2):9–19. doi: 10.1016/j.pain.2004.09.012. - DOI - PubMed
    1. Cane D, Nielson WR, McCarthy M, Mazmanian D. Pain-related activity patterns: measurement, interrelationships, and associations with psychosocial functioning. Clin J Pain. 2013;29(5):435–442. doi: 10.1097/AJP.0b013e31825e452f. - DOI - PubMed

LinkOut - more resources